AVAX Price Analysis: Range Holds At $11 Below A $12.01 Ceiling
AVAX price analysis on Binance data: three weekly closes near $11, a $12.01 ceiling, a $9.76 floor, an open 4h gap and two scenarios with clear 4h triggers.

In this article+
Avalanche's AVAX has gained about 53% from its September 16 swing low of $7.169, and the chart has stopped to catch its breath. AVAX price analysis on Binance data shows three weekly closes within a few percent of each other. They landed at $10.91, $11.10 and $10.98, all under a $12.01 ceiling.
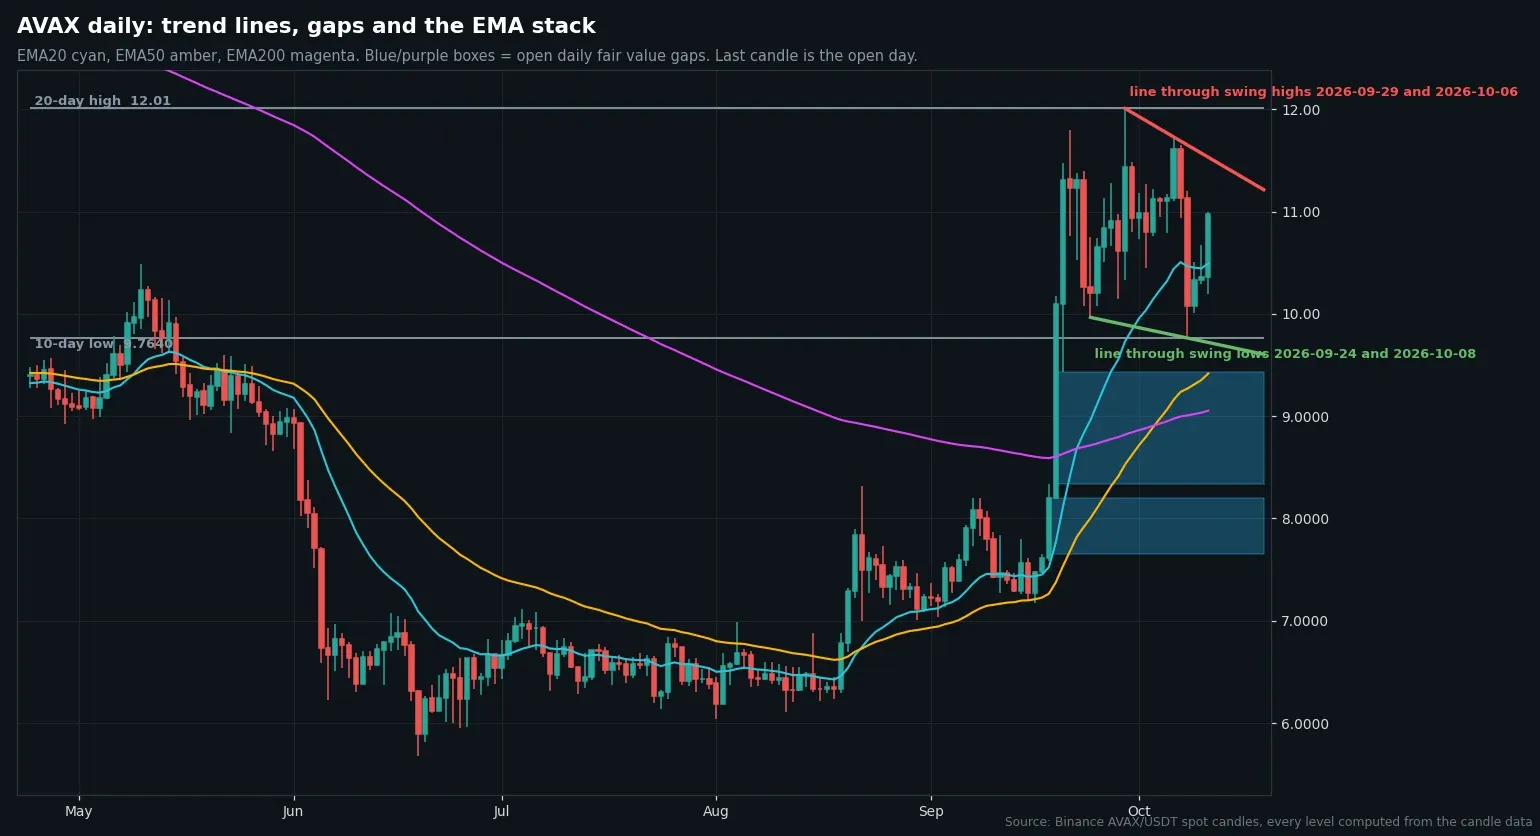
Daily AVAX/USDT chart from Binance data, showing the trend lines, open gaps and moving averages. Chart by Daniel Kiprop.
The pause in this AVAX price analysis has a shape. The ceiling is the $12.008 high from September 29, which came with a buy-side sweep above the earlier $11.799 peak and a quick rejection. The floor is the $9.764 low from October 8, reached in a sell-side sweep that closed back at $10.076 on the same day.
Between them, price has been choppy but orderly. The week of October 5 ranged from $9.764 to $11.730 and closed at $10.976, almost where the week before ended.
AVAX price analysis on the weekly and daily charts
Higher up the timeframe ladder the picture is bullish. The weekly chart flipped structure up in the week of August 17, and price has since traded above the $10.49 swing high from May 4. Each of the last three weekly closes has stayed over that old level.
On the daily chart, the trend stays up after a bullish break of structure on September 18. All three EMAs sit below price. Closest is the 20-day, near $10.49, and the 200-day is furthest down at about $9.05.
The October 11 candle is the freshest signal. It dipped to $10.192 early, then closed at $10.976 after opening at $10.363. That is a gain of about 6%. Volume was 2.68 million AVAX. That matches the quieter days of the range and sits well under the 7.0 million and 5.9 million traded on October 7 and 8.
What the four-hour chart adds
The 4h chart is where the nearer levels sit. A bullish fair value gap from the October 11 16:00 candle spans $10.433 to $10.818 and has not been filled. The last 4h swing lows are $10.192 from October 11 and $9.764 from October 8.
Above price, the 4h swing highs sit at $11.406 from October 7 and $11.73 from October 6. The last three closed candles all finished between $10.89 and $10.98, the final one at 04:00 UTC on October 12.
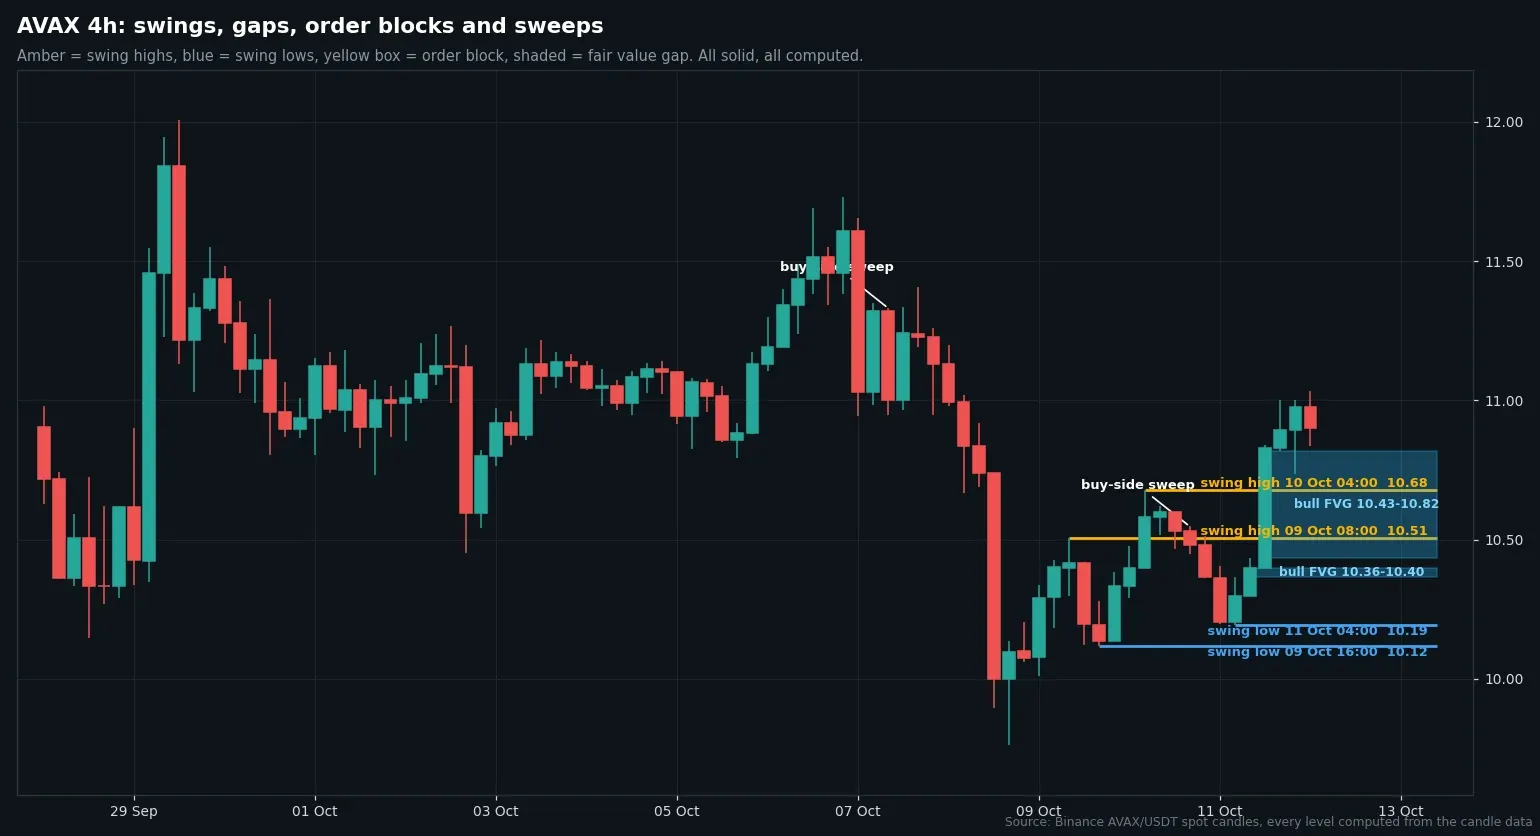
Four-hour AVAX/USDT chart from Binance data, showing the swing points and the gaps still open. Chart by Daniel Kiprop.
Two scenarios, with triggers
For the upside, the trigger is a 4h close above $11.73. That opens the way to $12.008, the range high and the 20-day high. A 4h close back under $10.818 would put the idea on hold.
For the downside, the first sign is a 4h close below $10.433, the bottom of the open gap. Under $10.192 the 4h structure turns down, and $9.764 comes back into view.
Bitcoin closed near $83,800 on Binance, above a rising 100-day average near $73,100. Altcoins usually like that setting. Every level in this AVAX price analysis comes from closed Binance candles through 04:00 UTC on October 12, 2026. None of it is a trade recommendation.
Written by
Daniel Kiprop covers exchanges, listings, stablecoins and institutional crypto moves for Times of Crypto Era. Stories start from company filings and official announcements, not secondary coverage.
View full profile →Related News

Ethena Fees Milestone: $1.06B Lifetime, But Monthly Fees Have Slowed
Ethena fees milestone check: DefiLlama shows $1.061B lifetime fees, crossed July 2, 2026, while monthly fees fell from $54.7M in August 2025 to $15.9M.

Compound V4 Update: Institutional Market Passed $60M In Deposits
This Compound V4 update reports $60M in Institutional Market deposits, $18M in USDC loans, a six-person engineering team and open COMP reward claims for users.

DATA Network Sui Migration: $30M Deal Retires Its Own Chain
The DATA Network Sui migration retires its own chain after a $30M Sui Foundation investment. See what changes for the DATA token, Trace and Walrus storage.