Caldera ERA Rally Gains 23% In A Day On A 24x Volume Candle
Caldera ERA rally: ERA climbs to $0.0782 after a 24x volume candle on Oct 17. See the 4h order block, fair value gaps and two close scenarios for traders.

In this article+
The Caldera ERA rally is the token's second sharp move in eight days. At 08:13 UTC on October 18 it traded near $0.0782 on Binance, up 22.8% from Saturday's daily close of $0.0637. It is still far under the $0.1137 high that printed on October 10, so the move retraces only part of that earlier spike.
How the move started
For most of October 15 and 16 the token drifted lower on thin volume. The low of the slide came at 16:00 UTC on October 16, when price touched $0.0571. Sellers had pushed ERA down about 50% from that October 10 spike. Volume faded each day, from 254.9 million tokens on October 10 to 19.2 million on October 16.
Then the 08:00 UTC candle on October 17 woke it up. It opened at $0.0594, ran to $0.0727 and closed at $0.0662. About 76.5 million tokens traded in those four hours. The median four-hour candle over the last 120 holds roughly 3.1 million, so this one was close to 24 times normal.
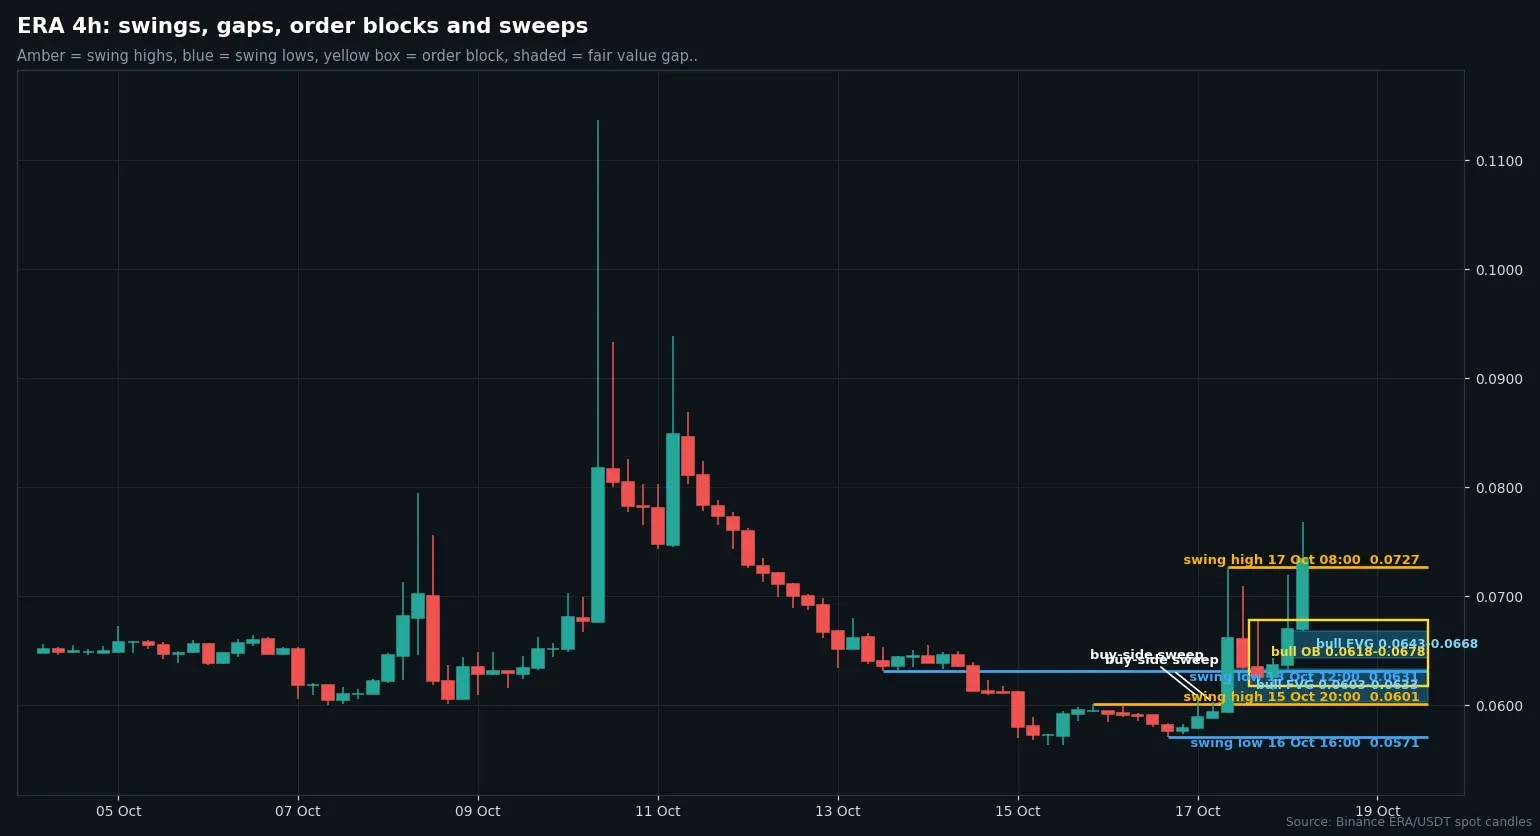
Four-hour ERA/USDT candles from Binance with swing points, a bullish order block and fair value gaps. Chart by Brian Otieno.
What the 4h chart shows about the Caldera ERA rally
The first rally faded, and ERA slipped back to $0.0614 by 20:00 UTC on October 17. That dip stayed inside a bullish order block, the zone between $0.0618 and $0.0678 where buyers had stepped in. It also held above a gap that spans $0.0603 to $0.0633.
The next push began at midnight. The 04:00 UTC candle on October 18 reached $0.0768 and closed at $0.0734, above the $0.0727 swing high from the day before. A close above a prior swing high is what traders call a break of structure. Volume on that candle was about 35.8 million tokens.
A buy-side sweep also sits just above. Back on October 10 and 12, price poked above $0.0795 twice, hit $0.0826 once, and then gave it all back.
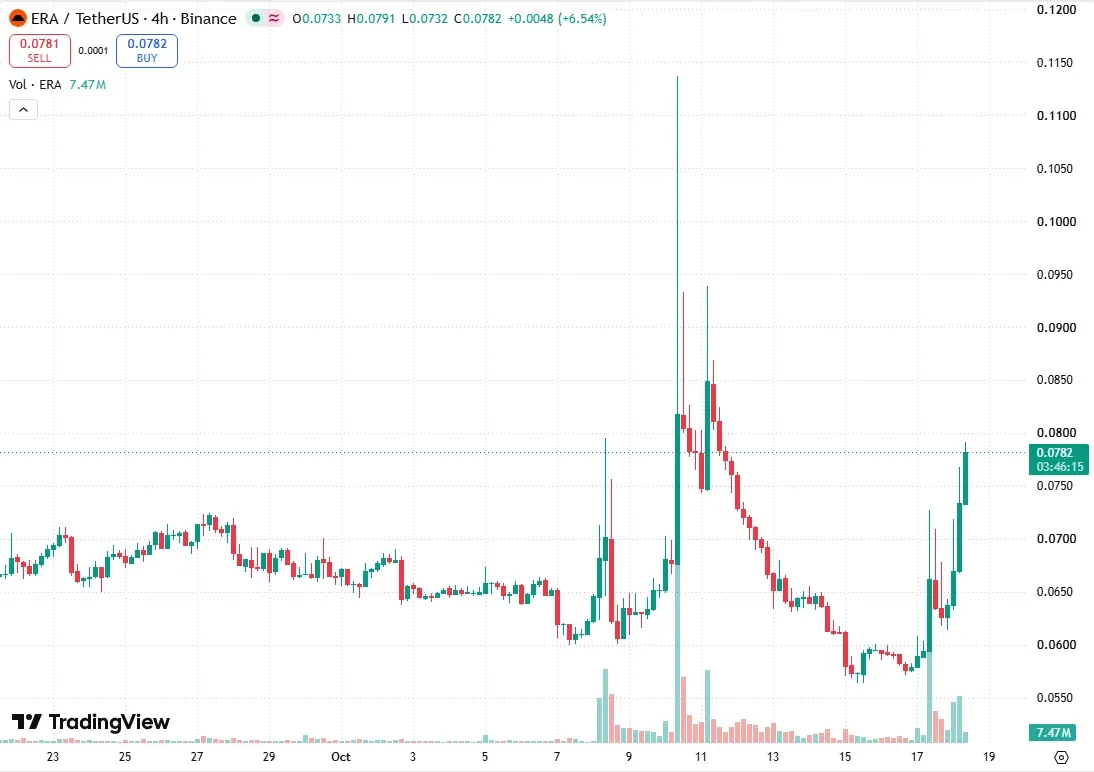
ERA/USDT four-hour chart on TradingView, captured at 08:13 UTC on October 18. Chart by Brian Otieno.
Daily and weekly charts behind the Caldera ERA rally
Zoom out and the picture is less friendly. The daily trend turned down again on October 15, when price closed under $0.06. The weekly trend has pointed down since a break on January 26, and the 200-day average sits near $0.117. ERA is now above its 20-day and 50-day averages, both close to $0.065. The Caldera ERA rally has cleared the short averages but nothing bigger.
Two scenarios for the Caldera ERA rally
The upside case needs a four-hour close above $0.0795, the level that capped the October 10 to 12 bounces. Above it, the next reference is the $0.0939 high from October 11.
The downside case starts with a four-hour close under $0.0618, the bottom of the order block. That would put the $0.0571 low back in play. It loses weight if price closes above $0.0795 first.
We have no lean on the Caldera ERA rally. Every level comes from closed candles, and none of it is advice to buy or sell ERA.
Loading…
Written by
Brian Otieno reports on Bitcoin and Ethereum markets, spot ETF flows and derivatives data for Times of Crypto Era. Every figure in the pieces is checked against the live source before publishing.
View full profile →Related News

Hyperliquid ETF Outflows Reach $17.5M In A Week, Up From $9.4M
Hyperliquid ETF outflows reached $17.5M in the week to October 16, up from $9.4M, led by 21Shares THYP. Farside data for BHYP, THYP and HYPG, plus HYPE price.

Stablecoin Market Cap Slips 0.34% In A Week As USD1 Falls 5.3%
The stablecoin market cap fell 0.34% in seven days to $302.542B on DefiLlama, while USD1 dropped 5.33% and USDS fell 2.88% in a day. Top-eight table inside.

Robinhood Chain TVL Reaches $1.05B, Within 1% Of Its Peak
Robinhood Chain TVL reached $1.052B on DefiLlama as of Oct 17, after passing $1B on Sep 20. Morpho, Uniswap and Arcus lead, and 30-day trends differ by chain.