AVA Volume Spike: A 22x Candle Takes Travala's Token To $0.4227
AVA volume spike: a 22x four-hour candle on Oct 17 took Travala's token to $0.4227. See the order block, fair value gaps and two close scenarios for traders.

In this article+
Travala's AVA token jumped 28.6% on Binance on October 17. The AVA volume spike hit one four-hour candle, the one starting at 16:00 UTC. It traded 14.5 million tokens when 664,000 is normal. Sunday morning the token sat near $0.39, well above Friday's close.
What the AVA volume spike looked like
The daily candle for October 17 opened at $0.2943 and closed at $0.3785, a gain of 28.6%. In between it ran up to $0.4227 at the 20:00 UTC print. That print is the day's high.
Volume tells the story better than the price does. The median four-hour candle over the last 120 holds about 664,000 tokens. The 16:00 candle came in near 21.8 times that, and the 20:00 candle added another 5.3 million. The biggest earlier candle in the last 120 traded 13.0 million, so this was the largest of the stretch.
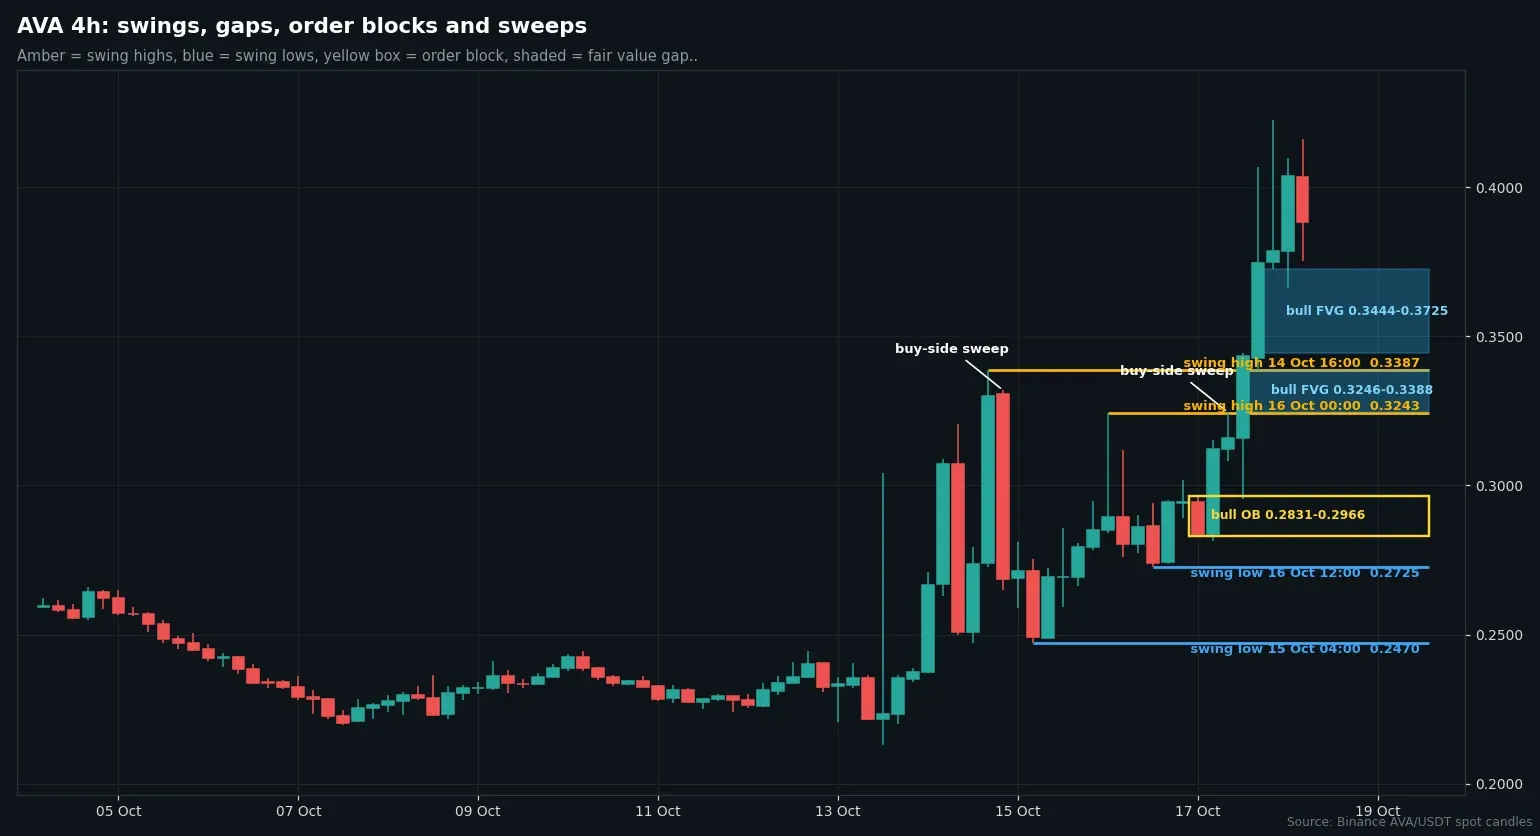
Four-hour AVA/USDT candles from Binance with swing points, a bullish order block and fair value gaps. Chart by Martin.
The size of the AVA volume spike against the token's value
CoinGecko lists AVA at about $27.4 million in market value, rank 691, with 70.2 million tokens circulating. Its 24-hour trading volume across all venues was near $50.0 million at the time of writing, roughly 1.8 times the market value. CoinGecko also shows a 68.5% gain over seven days. The all-time high is $6.45 from April 13, 2021.
A second wave, three days after the first
This was not the first burst. On October 13 and 14 AVA already jumped, and the daily high on October 14 reached $0.3387 on 41.6 million tokens. That was the busiest of the last eight days. The surge faded to $0.2685 at the close.
The new AVA volume spike cleared that earlier high with room to spare. Traders call a close above a prior swing high a break of structure. The daily chart printed one on October 15 at $0.2845, and October 17 pushed well past it.
Where the AVA volume spike sits on bigger charts
On the daily chart the trend is up. Price sits far above its 20-day average at $0.261, its 50-day at $0.234 and its 200-day at $0.224. The weekly chart is still labelled down, with a swing high of $0.332 from the week of September 14. Saturday's daily close of $0.3785 is above that line.
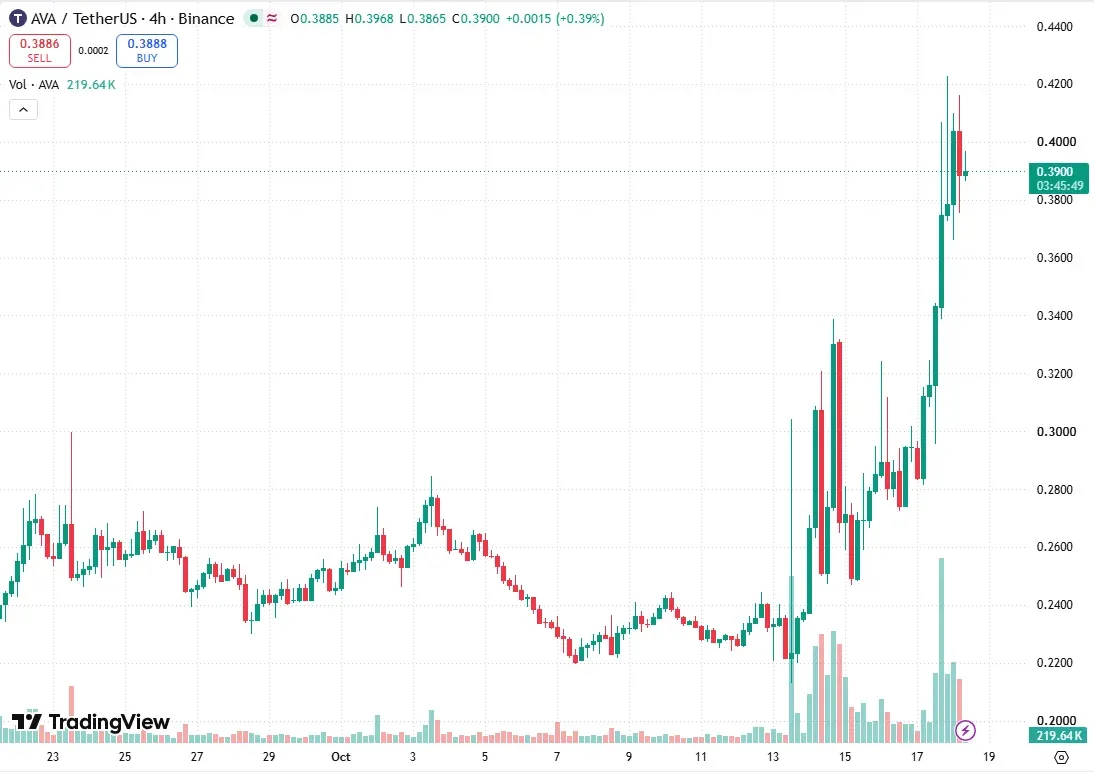
AVA/USDT four-hour chart on TradingView, captured at 08:17 UTC on October 18. Chart by Martin.
Two scenarios after the AVA volume spike
The upside needs a four-hour close above $0.4227. Nothing on the chart sits above it, so the next reference would be the weekly view.
The downside starts with a four-hour close under $0.3246, the bottom of a bullish gap that formed during Saturday's climb. That would put the $0.2831 to $0.2966 order block in play. It loses weight if price closes above $0.4227 first.
We have no lean on AVA. Every level here comes from closed candles, and none of it is advice to buy or sell the token.
Loading…
Written by
Writer and editor at Times of Crypto Era. Covers Bitcoin, DeFi, and market structure.
View full profile →Related News

PROM Daily Low At $4.80 Gets Swept Twice, Both On Heavy Volume
PROM daily low at $4.80 was swept twice in two days on heavy volume. See the 4h candles, bearish order blocks, averages and two close scenarios for Prom.

Caldera ERA Rally Gains 23% In A Day On A 24x Volume Candle
Caldera ERA rally: ERA climbs to $0.0782 after a 24x volume candle on Oct 17. See the 4h order block, fair value gaps and two close scenarios for traders.

Hyperliquid ETF Outflows Reach $17.5M In A Week, Up From $9.4M
Hyperliquid ETF outflows reached $17.5M in the week to October 16, up from $9.4M, led by 21Shares THYP. Farside data for BHYP, THYP and HYPG, plus HYPE price.