Bitcoin Whale Holdings Climb Above 3M BTC While Demand Lags
Bitcoin whale holdings climbed back above 3M BTC per CryptoQuant while apparent demand stays negative. See the charts, the supply in loss signal and caveats.

In this article+
Bitcoin whale holdings, as CryptoQuant defines the metric, are back above 3 million BTC, based on a CryptoQuant Quicktake by RugaResearch. CryptoQuant's metric sums balances in the 1,000 to 10,000 BTC band and strips out exchange and mining-pool entities. It stands at 3.02 million, back over the 3 million line it lost in the December 2025 drop, and it is a cohort total, not a list of named owners.
What the Bitcoin whale holdings chart shows
The 30-day change in that total turned positive on September 24 and reads +2.85% now, about 84,000 BTC added in a month. RugaResearch calls that the strongest monthly figure since early 2026. The pace has cooled, though. Weekly buying peaked near 55,000 BTC around the turn of the month and slowed to 16,500 BTC over the last seven days.
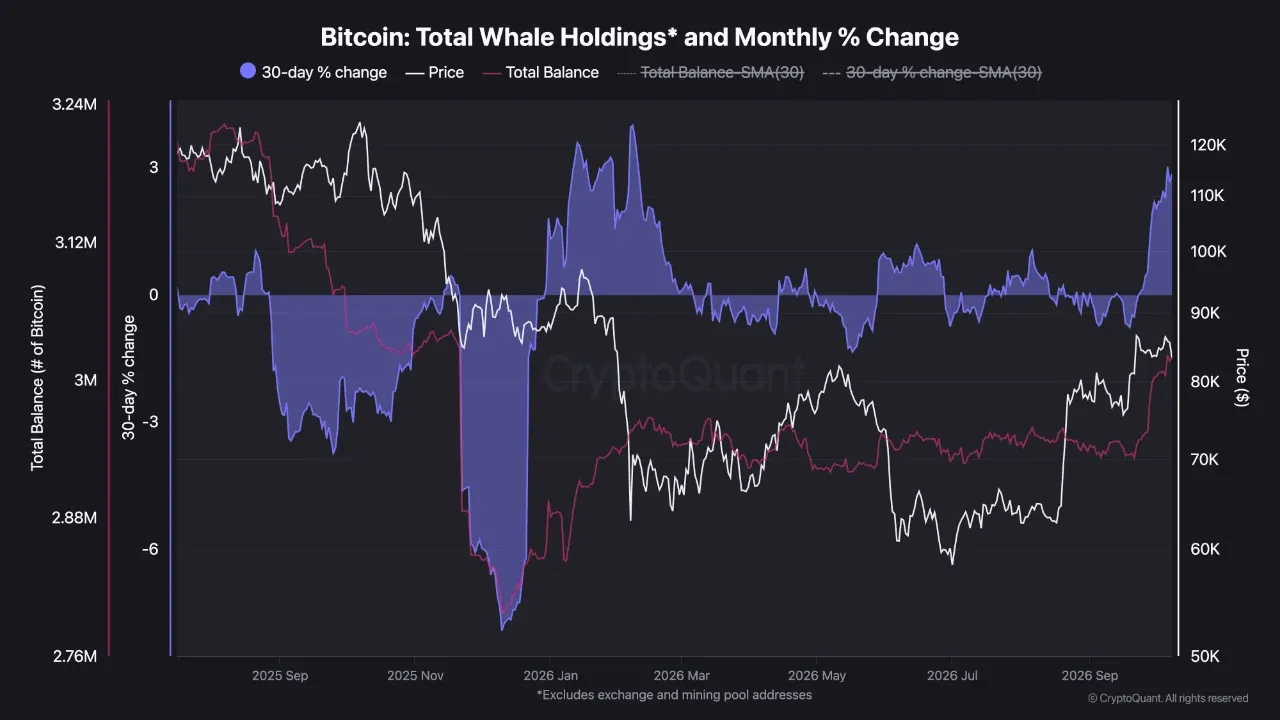
The whale holdings chart on CryptoQuant with total balance in red, monthly change in purple and price in white.
On the chart the red balance line is the thing to watch, and Bitcoin whale holdings are the reason it stands out. It sits flat through most of 2026 and then climbs steeply at the right edge, right as the price line pushes toward $85,000. Bitcoin itself is near $83,100 on October 11, per CoinGecko, which also shows a 7.5% gain over 30 days.
Demand has not caught up
The post adds a second chart on apparent demand. CryptoQuant defines it as the daily block subsidy minus the one-year change in inactive supply. Its 30-day sum bottomed at minus 207,000 BTC on September 20 and improved to minus 12,000 by October 8. The latest print slipped to minus 23,000, and the author notes the reading has been below zero since August 30.
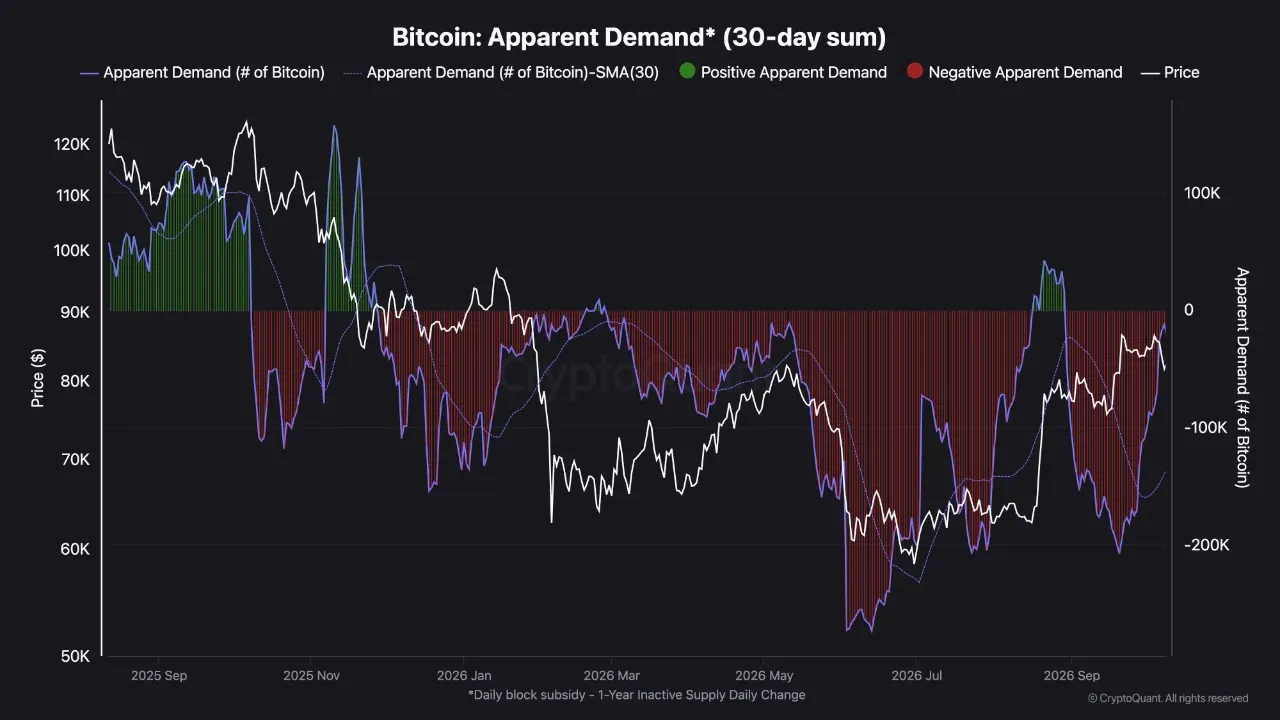
CryptoQuant's apparent demand chart, where red bars mark negative 30-day readings.
The author finds the timing interesting. The 1,000 to 10,000 BTC group turned up four days after demand hit its low, while broad demand was still far in the red. Their base case is a range for at least 30 days that works as an accumulation zone. The signal they want is demand turning positive and staying there.
A second chart points the same way
A separate Quicktake by G a a h tracks bitcoin's supply in loss on a seven-day average. It reads 26.76, under the 30 line and close to the 2026 low, after a spike toward 50 during the brief capitulation in June 2026. The author expects the figure to keep falling toward 10, which would match earlier cycle bottoms on the chart.
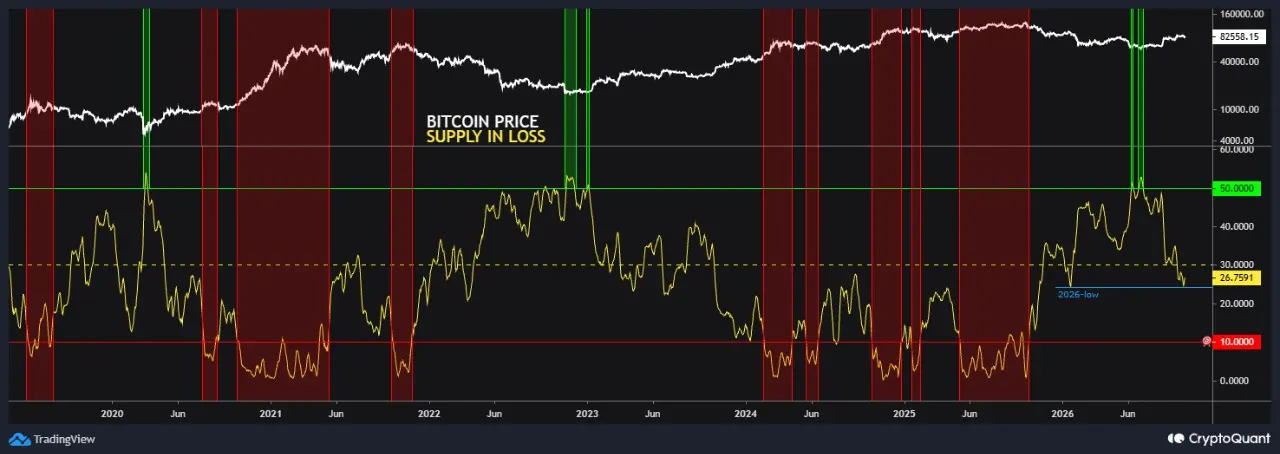
G a a h's supply-in-loss chart, with bitcoin price at the top and the 2026 low marked.
Both posts come from CryptoQuant's community feed, where they appear as author opinion. These are the authors' readings of CryptoQuant data. They are not our forecasts, and the data itself can be revised. Price context comes from CoinGecko, where bitcoin sits about 34% under its October 2025 high of $126,080. Both charts also show the same stretch of 2026, when price fell toward $60,000 in the summer before recovering.
Written by
Writer and editor at Times of Crypto Era. Covers Bitcoin, DeFi, and market structure.
View full profile →Related News

ETF Outflows Hit $1.2B For Bitcoin And Ether In One Week
ETF outflows reached $1.22B across bitcoin and ether funds in the week of Oct 5, with ether down nine sessions straight. See which funds lost most, day by day.

Bitcoin Funding Rate Turned Negative On Binance, Then Flipped Back
Bitcoin funding rate on Binance went negative Oct 5 to 8 but was not a nine-month low, per Binance's own history. See the prints, open interest and price.

Bitcoin ETF Outflows Reach $729M In Two Days After IBIT Reports
Bitcoin ETF outflows hit $484.9M on Oct 7 and $244.1M on Oct 8, per Farside. See which funds led the exits, the weekly total and how it compares to record days.