GNS Price Analysis: A 40x Volume Spike Takes GNS To $0.858
GNS price analysis: Gains Network's token hit 0.858 on October 13 on 40 times normal volume, then pulled back into a gap. Key levels and two scenarios.

In this article+
Gains Network's GNS token spent a week below $0.42 and then, in about eight hours on October 13, climbed to $0.858. That is its highest price since March 18. The day closed at $0.716 on Binance, nearly double the open, on roughly $9.4 million of volume. The previous seven sessions averaged about $230,000 a day. This GNS price analysis therefore starts with a volume jump of around 40 times.
How the GNS move started
The first push came from a trap below the range. At 12:00 UTC the four-hour candle dipped to $0.365, under the $0.377 swing low from October 9, and bought back at once. Traders call that a sell-side sweep. The same candle closed at $0.537, up about 47% from its open.
The next candle was bigger. It opened near $0.539, ran to $0.858 and closed at $0.818. A lower candle at 20:00 UTC, after the peak, closed at $0.716 and set the daily close.
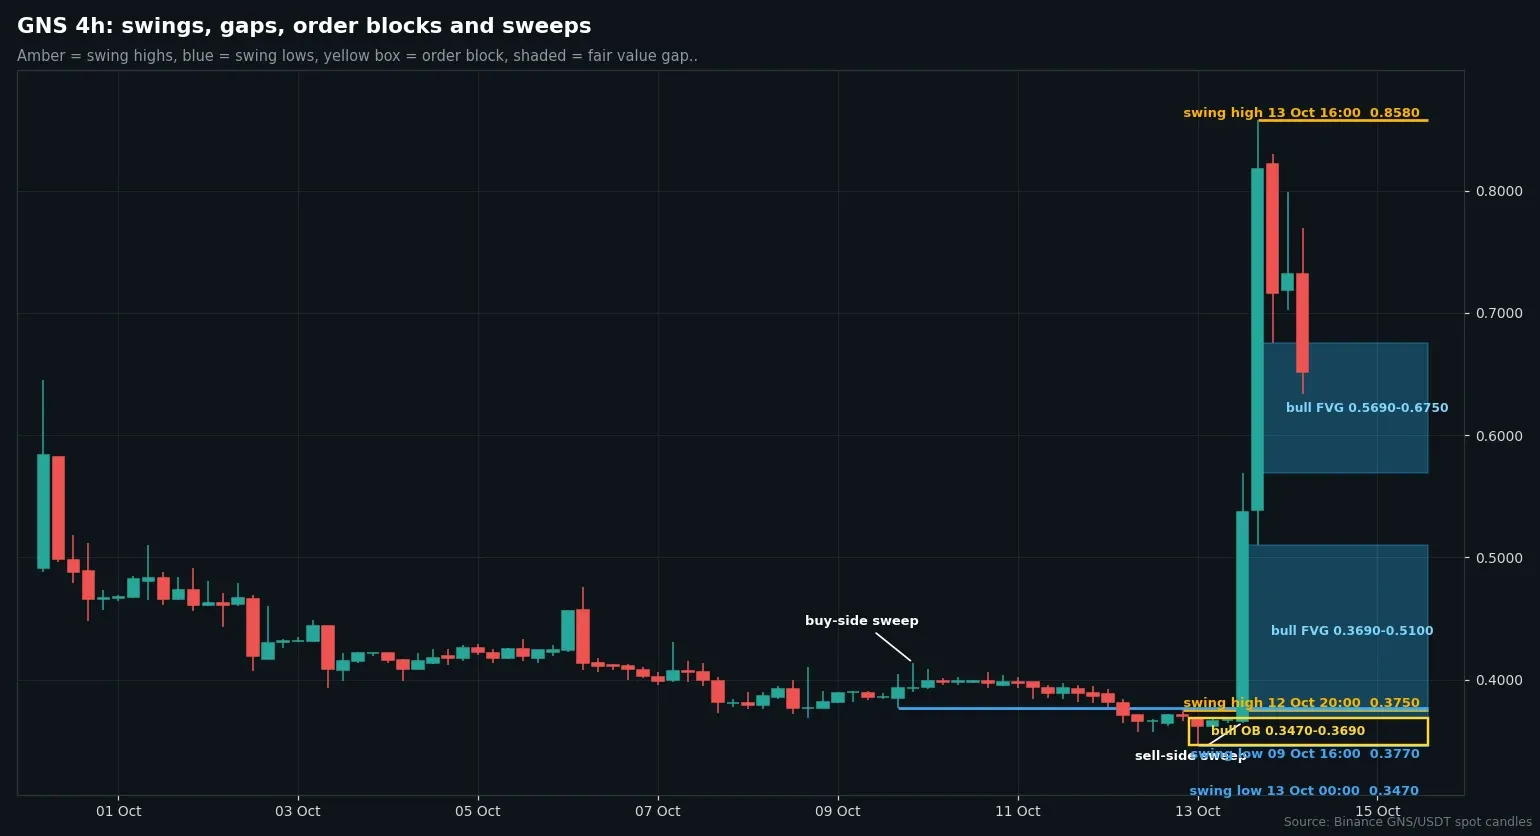
Four-hour GNS/USDT candles from Binance data. The shaded boxes are the gaps left by the move. Chart by Daniel Kiprop.
Gaps the run left behind
The move also reversed a long slide. GNS had traded above $0.64 on September 30 and then bled lower for almost two weeks. From the October 12 daily close of $0.370, the latest closed four-hour print of $0.652 is higher by about 76%.
Fast candles leave empty space behind them, known as fair value gaps. This run left two on the four-hour chart. The lower gap spans $0.369 to $0.510 and the upper one $0.569 to $0.675. Between them there is almost no trading history, since price crossed the zone in two candles.
A bullish order block sits at the base of the whole move, between $0.347 and $0.369. It formed on the 00:00 UTC candle on October 13, which also made the swing low at $0.347.
October 14 has been a retreat so far. The daily high is $0.799 and the low $0.612. The latest closed four-hour candle, ending at 08:00 UTC, finished at $0.652, which means price is trading inside the upper gap.
The GNS price analysis on bigger charts
On the daily chart a bullish break of structure printed on October 13 above $0.476. Price now sits over the 200-day average near $0.60, and well over the 20-day and 50-day lines near $0.45 and $0.46. The weekly chart is the weak point. Its trend still reads down, and the June 29 swing high at $0.655 sits almost exactly where price trades now.
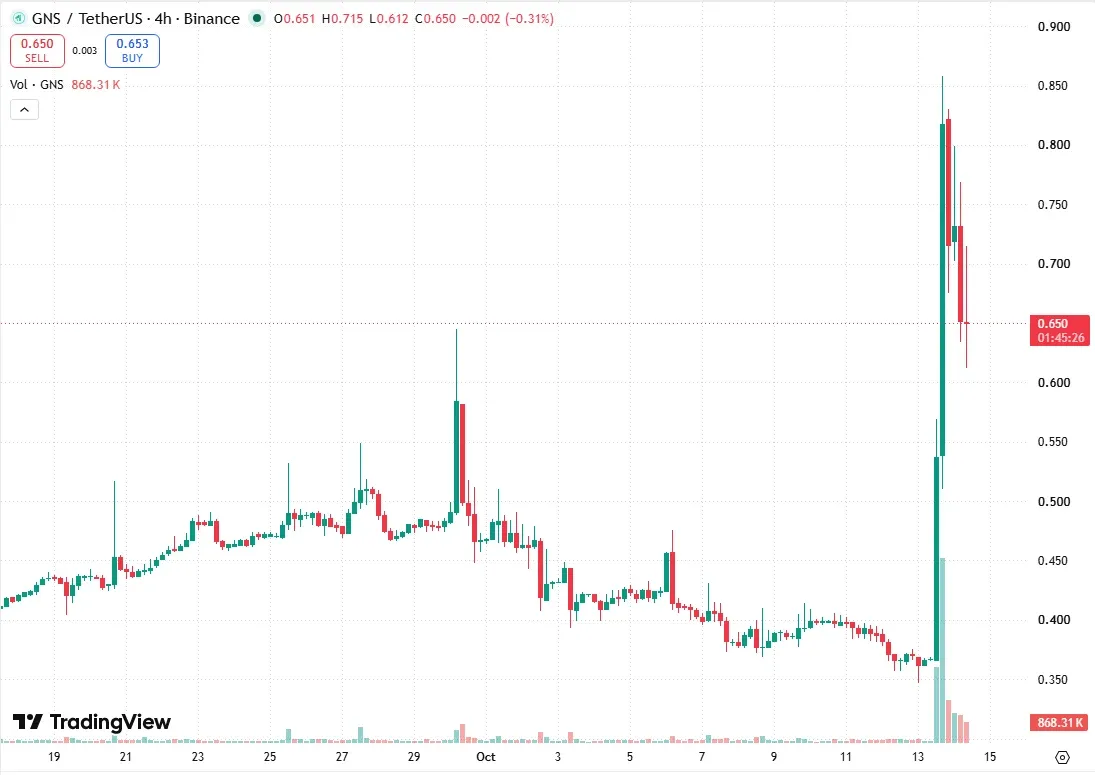
GNS/USDT four-hour chart on TradingView. Chart by Daniel Kiprop.
Two scenarios on four-hour closes
The bullish case needs a four-hour close above $0.799, the October 14 high. That would put the $0.858 peak back in play and turn the weekly swing high into support. The cautious case starts with a close under $0.569, the bottom of the upper gap. That opens a path toward $0.510, the top of the lower gap.
A close under $0.347 would wipe out the order block and the whole move. Every number in this GNS price analysis comes from closed Binance candles through 08:00 UTC on October 14, and it is not trade advice.
Loading…
Written by
Daniel Kiprop covers exchanges, listings, stablecoins and institutional crypto moves for Times of Crypto Era. Stories start from company filings and official announcements, not secondary coverage.
View full profile →Related News

APT Price Analysis: A Spike To $0.9655 Reversed 18% In Two Days
APT price analysis: the token spiked to 0.9655 on October 11, then fell about 18% in two days. See the gaps, order block and levels that now matter for APT.

PancakeSwap LP Fee Share Proposal: 88% To LPs, CAKE Emissions Cut 69%
The PancakeSwap LP fee share would rise to 88% on v3 and Infinity pools, with CAKE emissions cut about 69%, under an October 14 forum proposal. Rollout details.

OGN Price Analysis: Spike To $0.0534 Holds Most Of Its Gains
OGN price analysis: the Oct 8 spike to $0.05345 left a huge gap and a held base. See the key levels, the sweeps and two 4-hour scenarios with triggers.