OGN Price Analysis: Spike To $0.0534 Holds Most Of Its Gains
OGN price analysis: the Oct 8 spike to $0.05345 left a huge gap and a held base. See the key levels, the sweeps and two 4-hour scenarios with triggers.

In this article+
Origin Protocol's token has done something most spikes do not, which is hold most of its gains. On October 8 OGN jumped from $0.02285 to a high of $0.05345 on Binance and closed the day at $0.04567, up about 100%. Five days later it trades near $0.038, still well above the $0.023 where the day began. This OGN price analysis looks at why that matters and where the levels sit now.
OGN price analysis: what the spike left behind
The October 8 candle traded about $56 million. In the three sessions before it, daily volume had stayed between roughly $4 million and $8 million. Price gave back part of it quickly. The next three daily candles closed at $0.0390, $0.0340 and $0.0330, and each held above the area where the spike began.
On the four-hour chart the move left a very large bullish fair value gap. A gap is the empty space between candles on either side of a fast run, and this one stretches from $0.02332 to $0.03526. Price has not come back to fill it. A bullish order block sits just above it, between $0.03022 and $0.03243, and it was the base for the October 12 rebound.
The past two sessions
On October 12 the token swept the sell side first. It dipped under the $0.03314 low on the 12:00 UTC four-hour candle and recovered at once, a grab of resting orders below an obvious low. A push higher followed, reaching $0.04219 at 18:00 UTC, the top of the day.
The same session ended with a sweep on the other side. At 20:00 UTC price poked above $0.03757 to $0.04003 and slid back under it. The bounce on October 13 has now carried price to a high of $0.04146 at 06:00 UTC, which sits just under the October 12 peak.
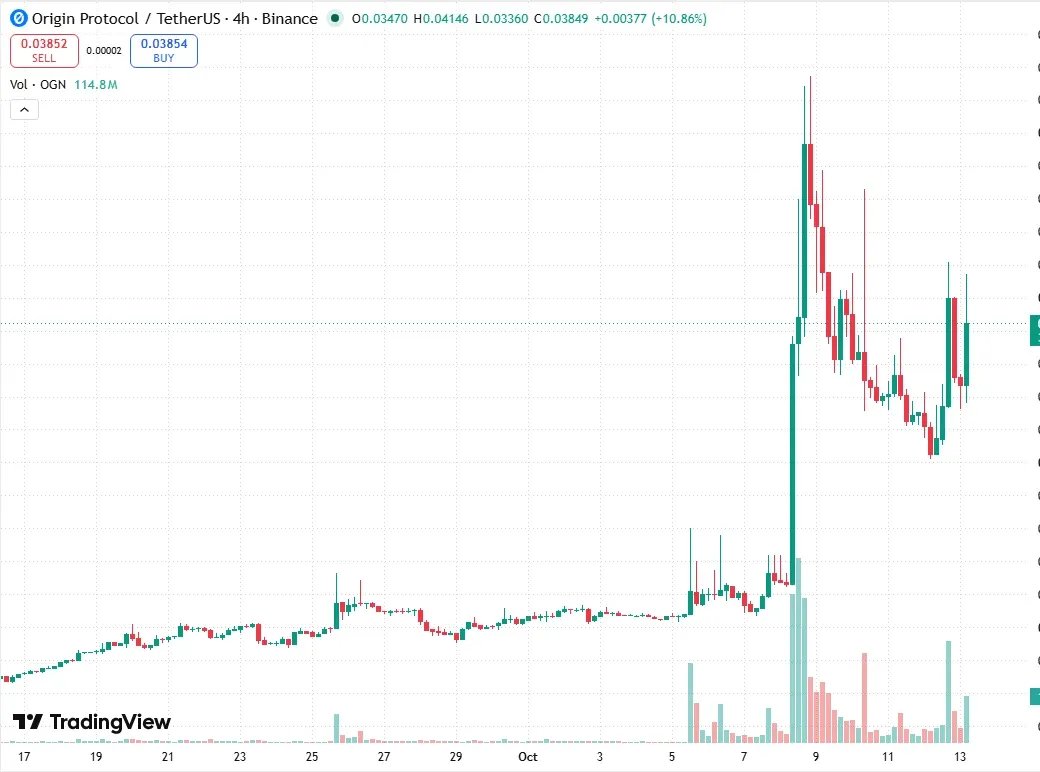
OGN/USDT four-hour chart on TradingView. Chart by Samiran.
Levels and two scenarios
The weekly chart printed a bullish break of structure on October 5, and the daily trend reads as up. Price now sits well above its 20-day, 50-day and 200-day averages, which bunch together near $0.022 to $0.027. Bitcoin adds a supportive backdrop, since it closed near $83,800 above its own rising 100-day average.
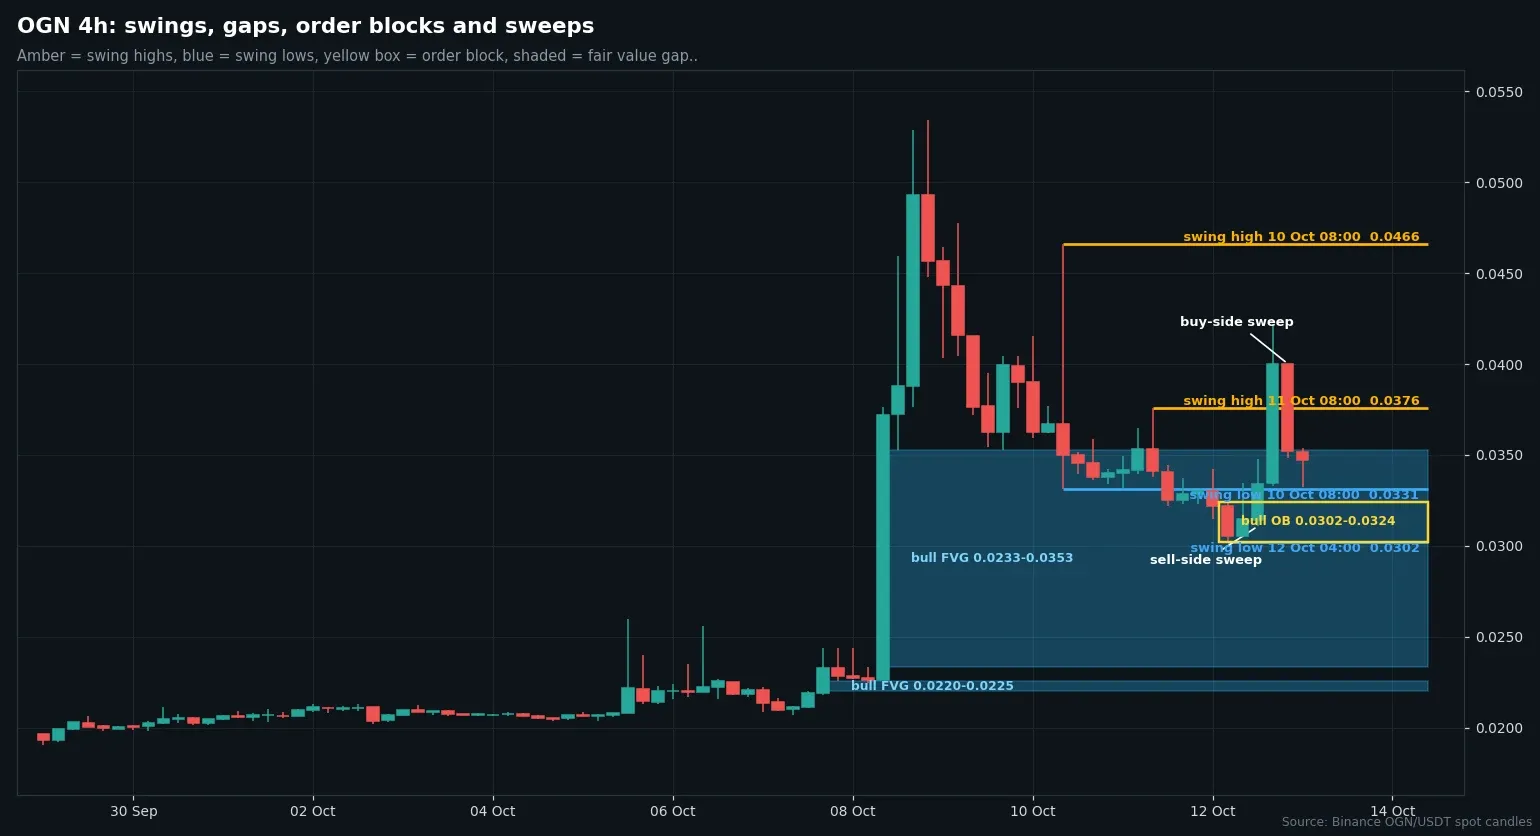
Four-hour OGN/USDT chart from Binance data, showing the swing points, the gap and the order block. Chart by Samiran.
The upside map is short. The first test is the October 12 high at $0.04219. Past it comes the October 10 high and then the spike peak at $0.05345, which is also the weekly and monthly high. The bullish trigger is a four-hour close above $0.04219, and a close back under $0.03324 would cancel the idea.
The downside map starts at that same $0.03324 low. A four-hour close under it points toward the order block, with $0.03243 as its top and $0.03022 as its base. Only a loss of the whole block would bring the large gap back into play. Every level in this OGN price analysis comes from closed Binance candles through 07:00 UTC on October 13, and none of it is trade advice.
Loading…
Written by
Samiran is a well-known crypto writer and founder of Pressefy and News Coverage Agency, and a contributor at Hackernoon. He covers the crypto and blockchain industry with a focus on emerging projects, market trends, and the business side of Web3.
View full profile →Related News

WalletConnect Staking APY Vote: 4-Week Rate Rises To 5%
WalletConnect staking APY vote: P4 would lift the 4-week rate from 0.78% to 5.00% and the 104-week rate to 24.52%. See the live tally and the caveats.

PAXGy On Aave: LlamaRisk Backs Gold Vault, Flags Loan Risk
PAXGy on Aave: LlamaRisk backs a tokenized gold vault listing but flags borrower concentration and unverified loan statements. See the proposed limits.

BOME Price Analysis: A 29% Daily Drop After A Failed Sweep
BOME price analysis after a 29% daily drop: the failed push above $0.00117, the 200-day average at $0.000767 and two scenarios with clear 4-hour triggers.