BOME Price Analysis: A 29% Daily Drop After A Failed Sweep
BOME price analysis after a 29% daily drop: the failed push above $0.00117, the 200-day average at $0.000767 and two scenarios with clear 4-hour triggers.

In this article+
Book of Meme lost 29% in one daily candle on October 12, and the chart shows exactly where it started. The day before, BOME pushed to $0.001171 on Binance, its highest print in more than a week, and then gave it all back. That failed push led straight into the biggest red day of the month. This BOME price analysis walks through the structure behind the drop and the levels now in play.
What happened on October 12
The setup is easier to read with the days before it. BOME had pushed above its $0.001052 swing high several times in the days before, peaking at $0.001171 on October 11. Sellers answered that peak straight away. The four-hour candle that carried it closed under the high, and the next candle left a bearish order block between about $0.001090 and $0.001153.
The daily candle opened at $0.001099 and closed at $0.000782. Volume was about $10.8 million, against $1.7 million to $3 million on most days earlier in October. Price kept sliding after midnight, reaching a low of $0.000746 on October 13 before a small bounce to around $0.000800.
On the four-hour chart the damage came in a staircase. The 04:00 UTC candle on October 12 broke from $0.001091 down to $0.000953, and the four candles after it all closed lower. Several of them left a bearish fair value gap behind, which is the empty space between the candles on either side of a fast move.
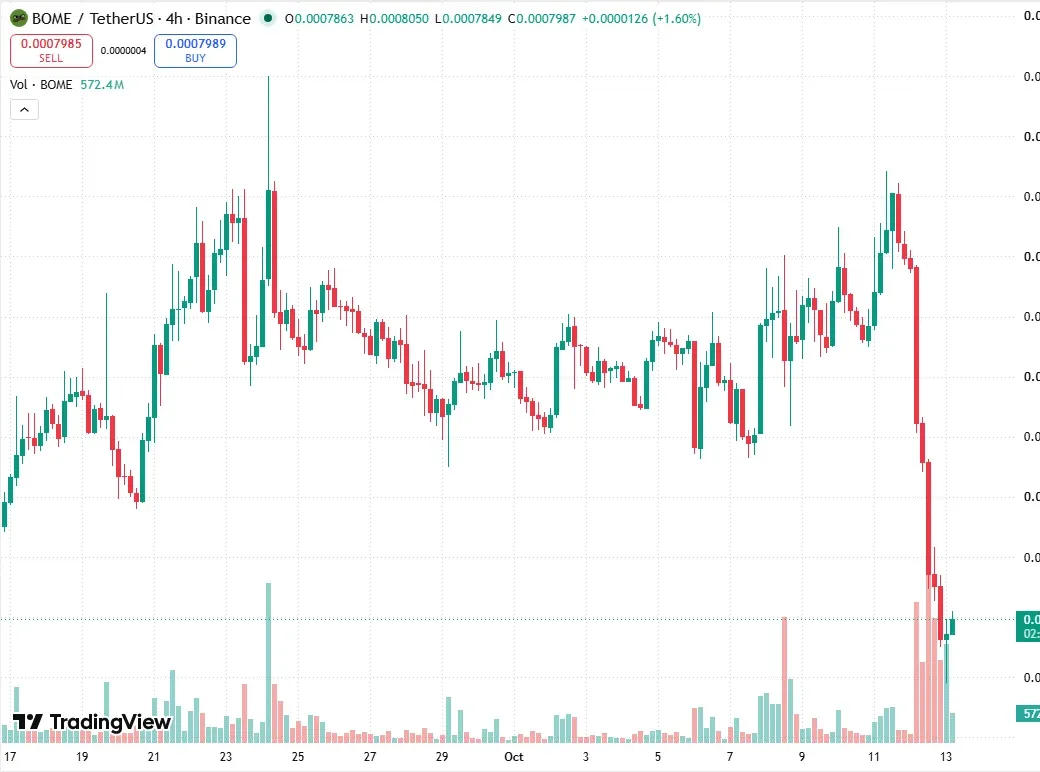
BOME/USDT four-hour chart on TradingView, showing the October 11 high and the staircase lower. Chart by Daniel Kiprop.
The daily chart confirms the break. Price closed under the $0.000932 swing low from October 6, which printed a bearish break of structure on the daily timeframe. Until that day the pair had spent about a week between roughly $0.00093 and $0.00117, so the break also ended a range.
BOME price analysis: where price sits now
The decline stopped almost exactly on the 200-day moving average, near $0.000767, and the low at $0.000746 poked just under it. The same area holds a bullish daily order block between $0.000756 and $0.000799 from August 18. The average, the order block and the low all sit within a few percent of each other. That is why this zone is the first one to watch.
Above price, the nearest sellers' footprints are the bearish four-hour gaps. The newest runs from $0.000799 to $0.000813, then comes a gap from $0.000859 to $0.000921, and another from $0.000932 to $0.000953. The $0.000932 swing low is also the line the daily break of structure came from, so it works as a ceiling now.
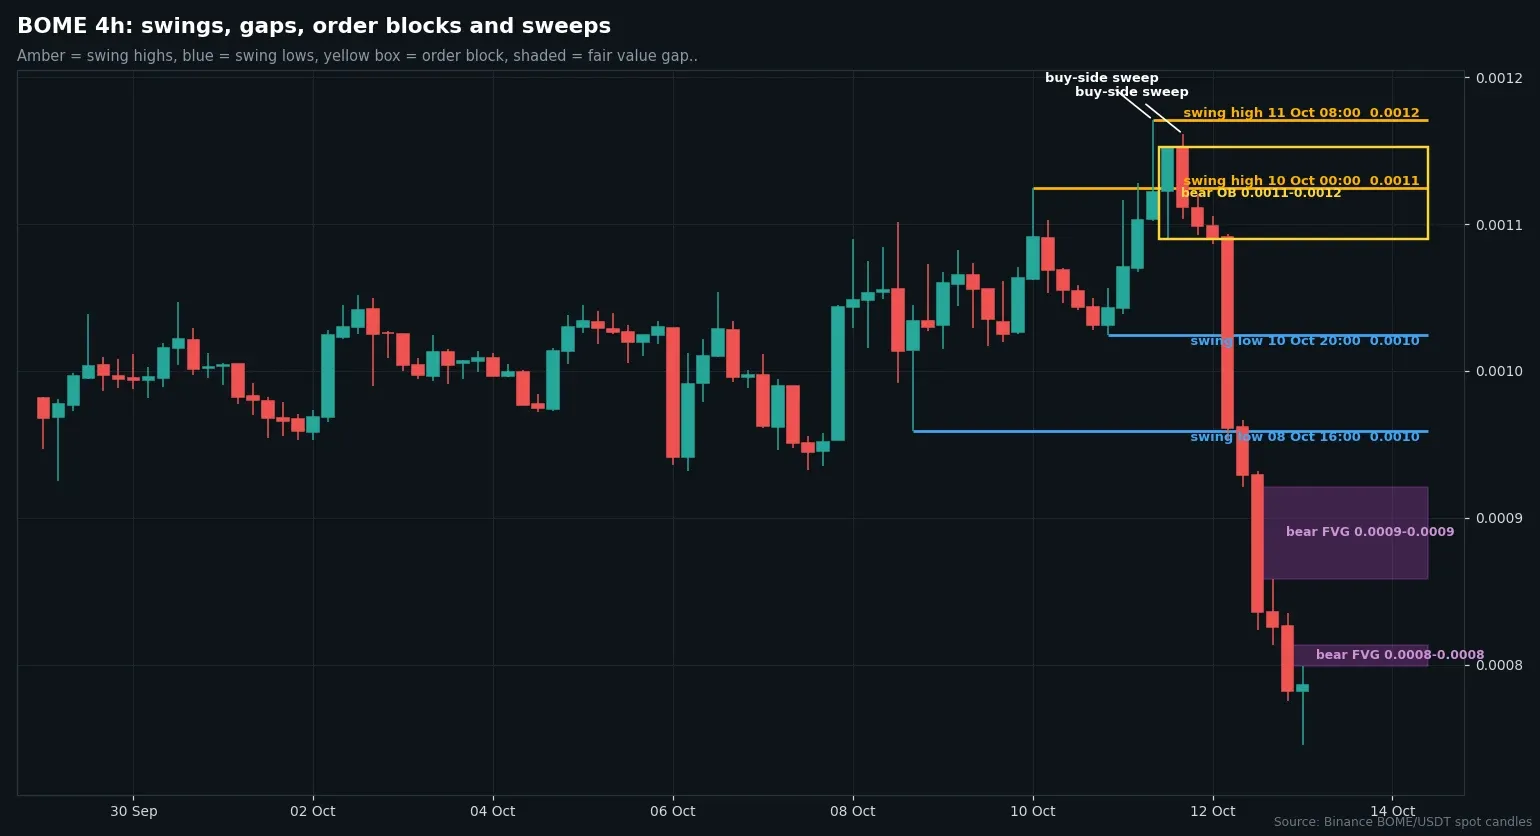
Four-hour BOME/USDT chart from Binance data, with swing points, gaps and order blocks. Chart by Daniel Kiprop.
Bitcoin stayed steady by comparison, closing near $83,700 above its own rising 100-day average. BOME fell almost 30% in the same window, so this BOME price analysis treats the drop as specific to the token.
Two scenarios with triggers
For the upside, the first trigger is a four-hour close above $0.000813, the top of the newest gap. That would open the path toward $0.000932, and a close back under $0.000746 would cancel it.
For the downside, the trigger is a four-hour close under $0.000746. The next reference is an old daily gap between $0.000661 and $0.000747 from August 10. The range between those two lines is tight, so the next few closes will show which side holds.
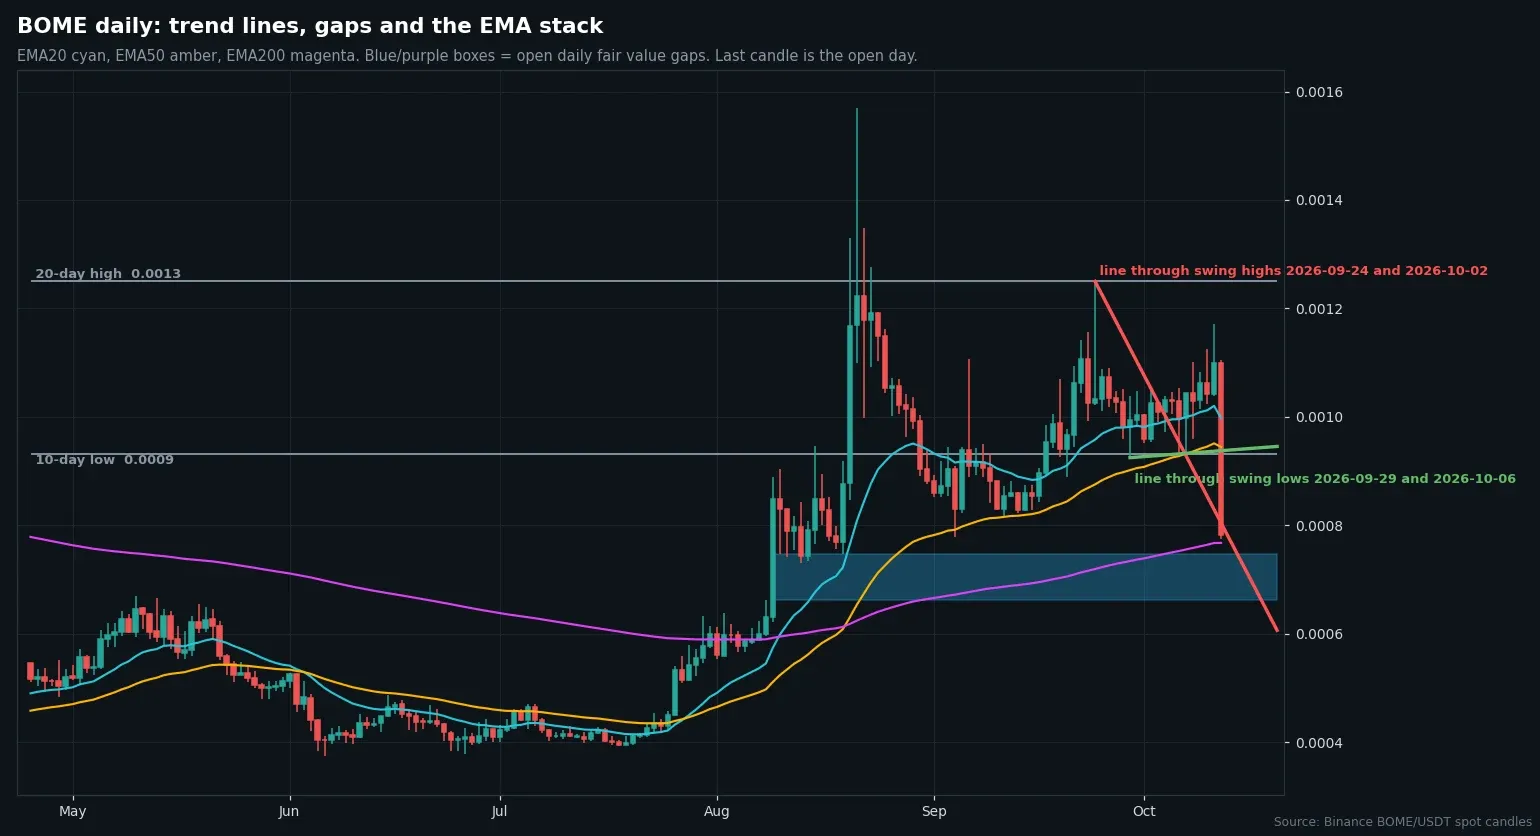
Daily BOME/USDT chart from Binance data. Chart by Daniel Kiprop. All levels come from closed Binance candles through 05:00 UTC on October 13 and describe structure only, not trade advice.
Loading…
Written by
Daniel Kiprop covers exchanges, listings, stablecoins and institutional crypto moves for Times of Crypto Era. Stories start from company filings and official announcements, not secondary coverage.
View full profile →Related News

PAXGy On Aave: LlamaRisk Backs Gold Vault, Flags Loan Risk
PAXGy on Aave: LlamaRisk backs a tokenized gold vault listing but flags borrower concentration and unverified loan statements. See the proposed limits.

Osmosis Validator Set Vote: 70 To 30 Seats, Fee Split Changes
The Osmosis validator set could shrink from 70 to 30 and community pool fees could go to stakers. See both proposals, the live tally and what changes.

GTC Price Analysis: Upbit Listing Spike Hits $0.393 Then Fades
GTC price analysis after the Upbit listing: an hourly spike to $0.393 on $9.5M volume, the fair value gap it left, and two scenarios with clear triggers.