IOST Price Analysis: Volume Jumps 66x As IOST Climbs 70%
IOST price analysis after the October 19-21 surge: huge volume, a staircase of higher 4h closes near $0.00127 and two scenarios taken from closed candles.

In this article+
IOST barely moved on October 19. A day later it led Binance's 24-hour gainers among liquid pairs, and at 08:00 UTC on October 21 it traded near $0.00125. This IOST price analysis walks through how the move built, using closed candles only.
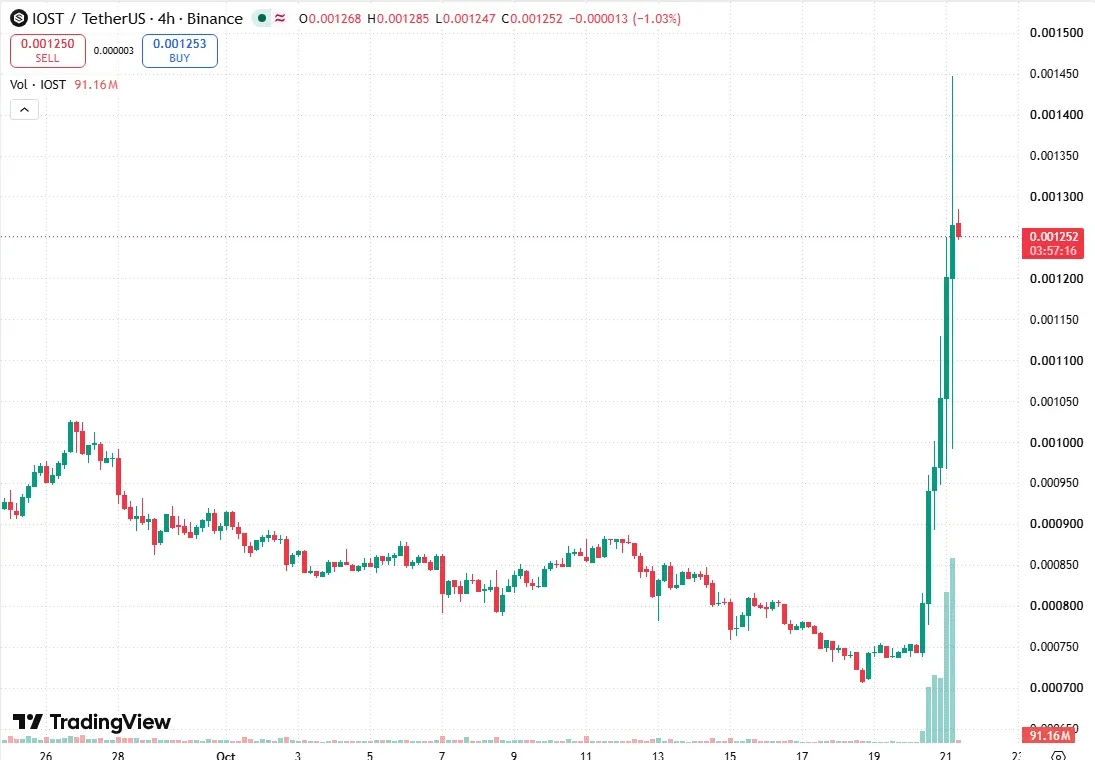
IOST/USDT on the 4h chart at TradingView, read at 08:02 UTC on October 21. Source: TradingView, IOSTUSDT on Binance.
How the IOST price analysis starts
For most of last week IOST drifted lower, ending with a low near $0.00071 on October 18. October 19 was flat, with 4h candles trading between about 15 million and 41 million tokens. The median 4h candle over the last 120 traded about 58 million.
The change began with the 08:00 UTC candle on October 20, which traded about 514 million tokens. The next one traded about 2.5 billion. The two after that each topped 2.8 billion, and the midnight candle on October 21 came in near 6.8 billion. The candle that opened at 04:00 UTC reached 8.3 billion with a high near $0.00145 and a low near $0.00099.
Daily volume shows the same break. About 135 million tokens traded on October 19. The October 20 daily candle traded roughly 8.9 billion, around 66 times that, and closed at $0.00105 after opening near $0.00075.
What the structure says
Since the 08:00 candle on October 20, each 4h candle has closed above the one before. It started near $0.00080 and finished near $0.00127, with no lower close along the way. Two bullish gaps were left behind. A small one sits near $0.00075 and a wider one begins around $0.00082.
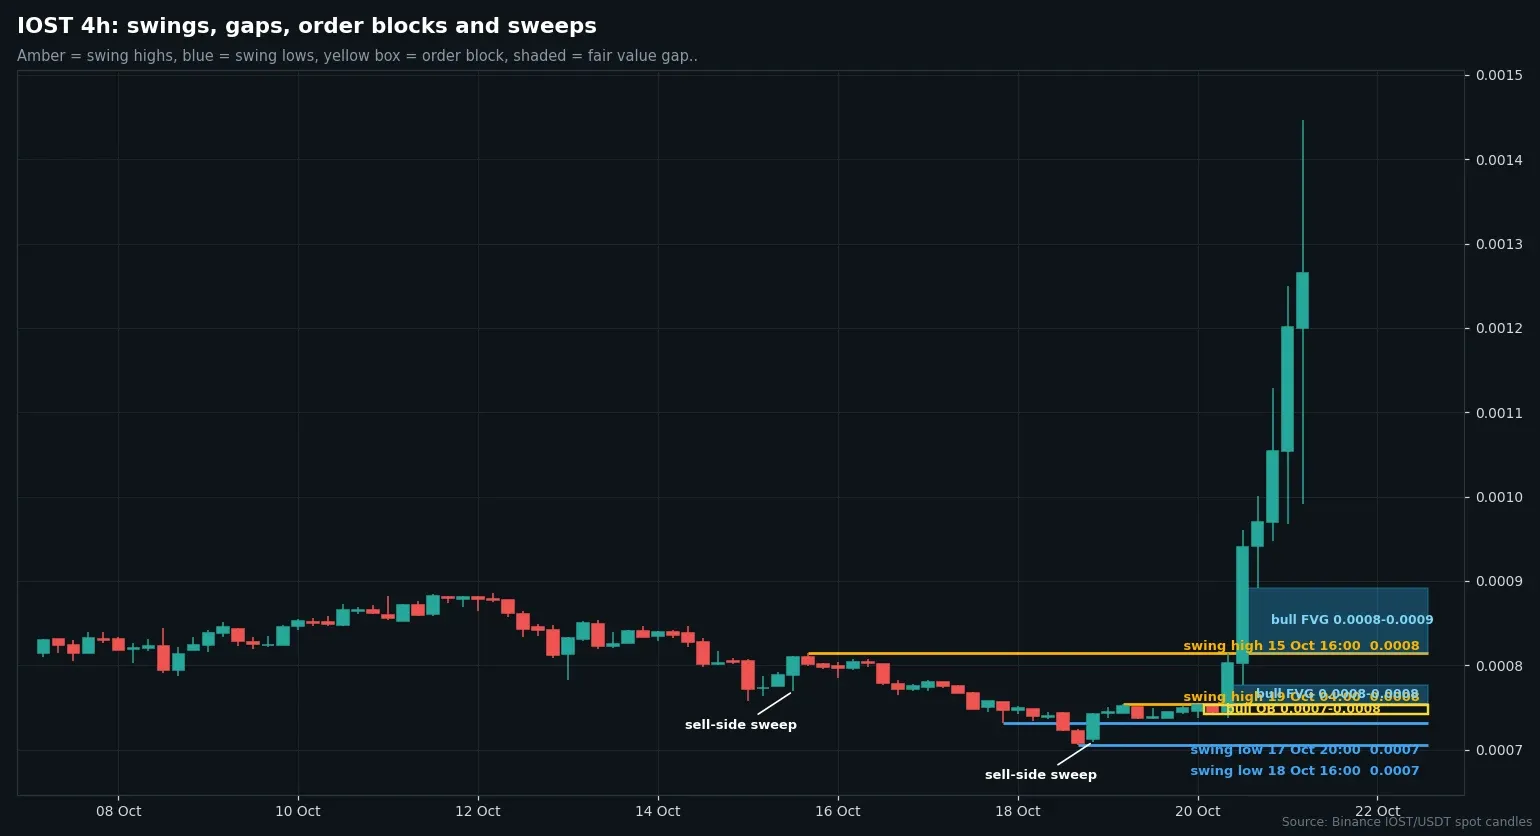
Four-hour candles from Binance, with swing points, open gaps and an order block drawn in. Chart by Faith Njeri.
On the daily chart, the October 20 close cleared the October 12 swing high near $0.00089. That turned the daily structure up. Price also sits over the 20-day and 50-day exponential averages. Both are a little above $0.00082, and the 200-day is near $0.00095.
The weekly chart paints a different picture. Its trend still reads down, and a daily swing high from September 9, near $0.00245, is about twice the current price. TradingView's panel showed 15.2 billion tokens traded over 24 hours against a 30-day average of 1.43 billion. This IOST price analysis treats the move as a sharp bounce inside a larger downtrend.
Two IOST paths from the 4h closes
The upside case needs a 4h close over $0.00145, the high of the most recent spike candle. That would open the way toward the September high, which is far above price.
The downside case begins with a 4h close under $0.00105, the October 20 daily close. A slide to $0.00089, the broken swing high, would test whether that level now holds as support. A daily close below it would take the daily structure back down.
We have no lean here. The volume is extreme against the token's own history, and candles this large can reverse quickly in either direction. These levels come from closed Binance candles and are not advice to trade.
Loading…
Written by
Faith Njeri covers DeFi protocols, exploits and onchain security for Times of Crypto Era. Project post-mortems and governance proposals are read in full, and each incident is traced back to the team's own disclosure.
View full profile →Related News

Qubic Weak Seeds: Wallet Used Math.random Before The 4.26.4 Fix
The Qubic weak seeds problem traced to Math.random in the wallet. A fix shipped October 18, the network restarted, and a claim window runs to May 1, 2027.

NEAR Issuance Cut To 1.6% Is Live In A House Of Stake Vote
The NEAR issuance cut in HSP-029 would lower maximum issuance from 2.5% to 1.6% over 24 months. The House of Stake vote closes November 2 at 4:48 pm UTC.

Balancer Wind-Down Gets Dates: Pools Pause Oct 30, DAO Ends In 2027
The Balancer wind-down now has a calendar. Pools pause October 30, the v3 vault stops November 30 and redemption starts May 31, 2027, per a forum spec.