MAGIC Price Analysis: A 146% Spike Reversed 28% In One Hour
MAGIC price analysis: Treasure spiked to $0.1639 on Oct 10 and reversed 28.7% in one hour. See the structure, the held gap and two scenarios with 4h triggers.

In this article+
MAGIC price analysis comes down to two daily candles. On Friday, October 9, Treasure's token rose from $0.0665 to a close of $0.1230 on Binance spot, with 340.9 million MAGIC traded against a 20-day average of 73.0 million. On Saturday it hit $0.1639 and then closed at $0.0976 on 460.7 million.
MAGIC price analysis: the spike and the reversal
The worst of the reversal came in one hour. The 07:00 UTC candle on October 10 opened at $0.1595 and closed at $0.1137, a drop of 28.7% on 125.9 million MAGIC of volume. The day ended below where it began, which leaves a long upper shadow on the daily chart. The whole week's candle now spans $0.0606 to $0.1639, a range of roughly 170%.
Structure had already turned before the spike. The weekly chart flipped up in the week of September 28 on a close above $0.0556, and the daily chart broke up on September 20 above $0.0472. The October 9 candle then ran through the September swing highs at $0.0644 and $0.0692 in a single session.
What price is doing now
Sunday's candle shows the first reaction, and the stretch is large: price is still about 88% above its daily EMA20 at $0.0665, with the EMA50 at $0.0556 far lower. Price dipped to $0.0926 and then recovered to $0.1250 by 09:00 UTC, and that low held just above the $0.0921 floor of a four-hour fair value gap. The gap stretches up to $0.1132, so the market has so far respected that zone.
The daily chart left its own gap, from $0.0671 up to $0.0968, and Sunday's dip to $0.0926 only touched the upper edge of it. Overhead, the old daily swing highs sit at $0.1502 from October 2025 and $0.1510 from December, with Saturday's $0.1639 above them. Underneath are the $0.0968 low from October 10 and the lower gap that begins at $0.0806.
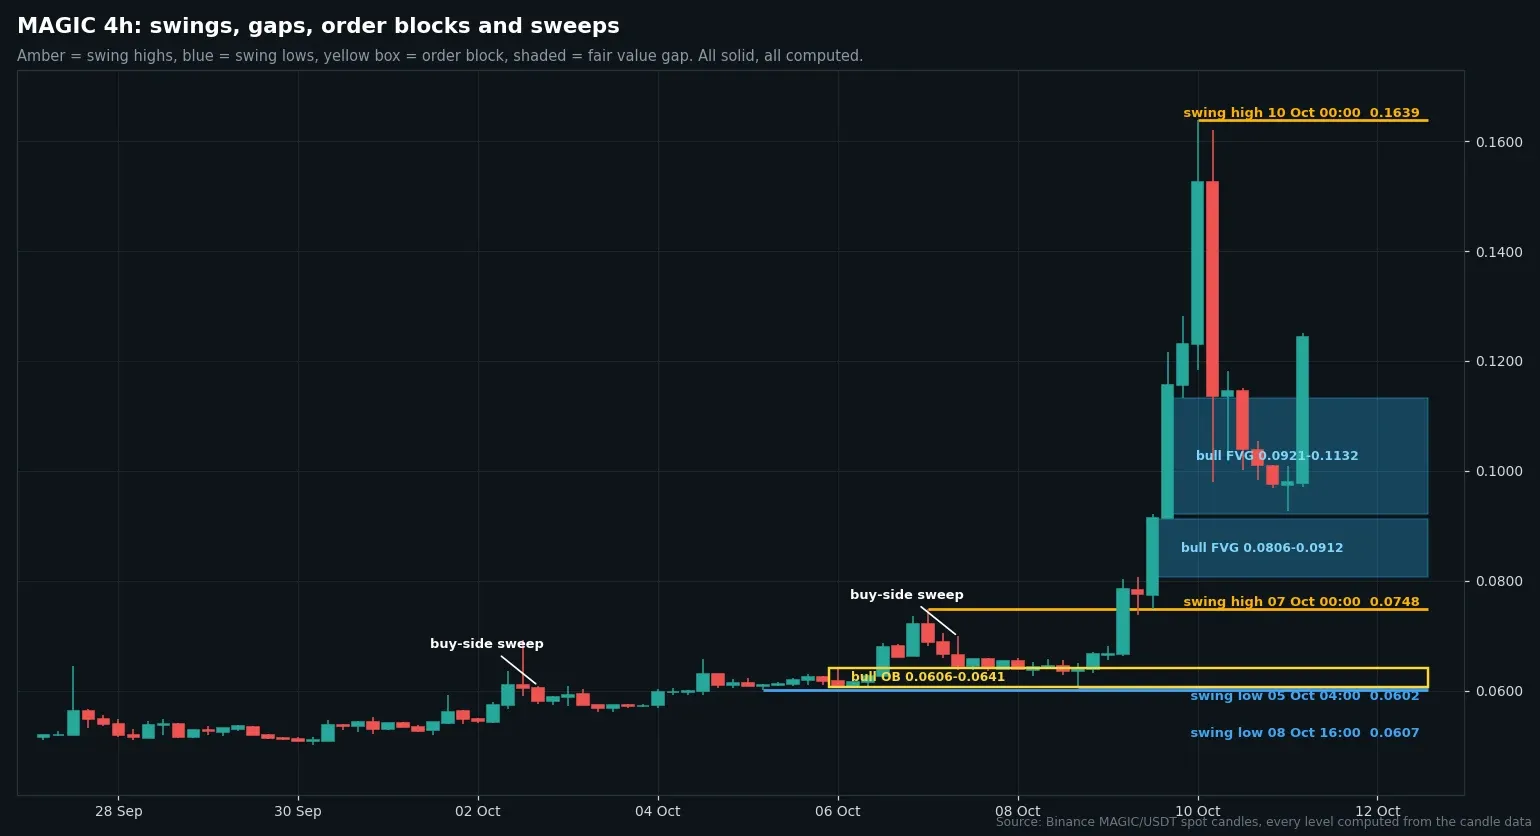
Four-hour candles with computed swings and fair value gaps, from Binance MAGIC/USDT.
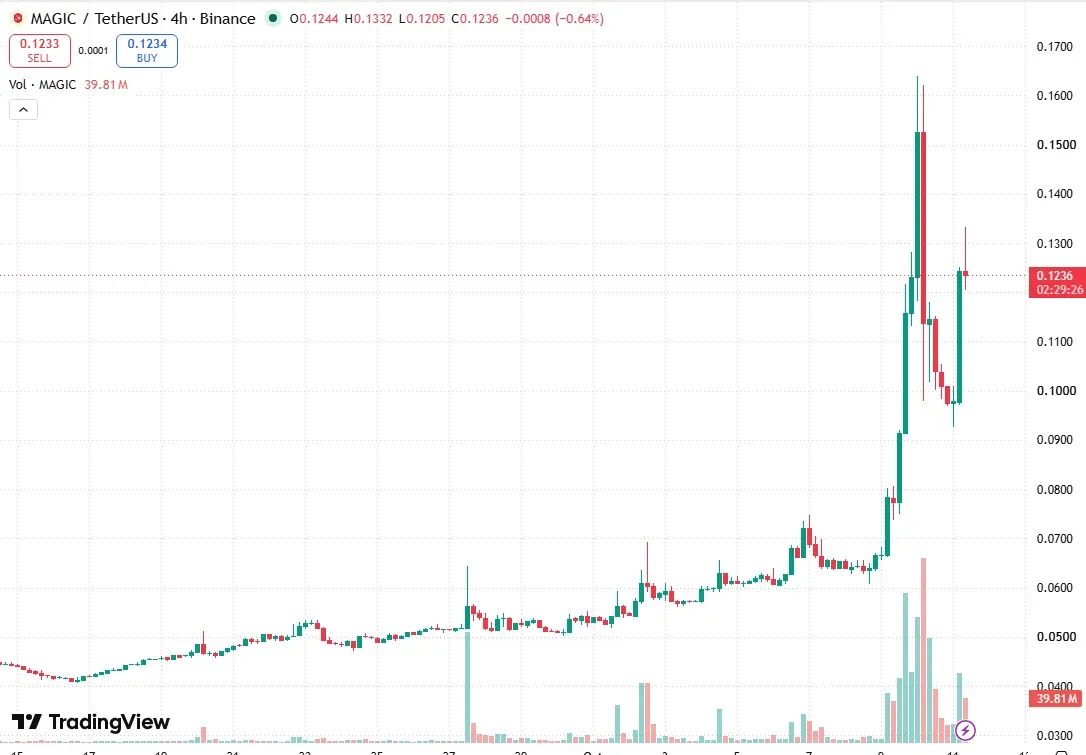
The TradingView four-hour MAGIC/USDT chart used to cross-check the swings and the volume.
Two scenarios, with 4h triggers
The upside case needs a 4h close above $0.1332, Sunday's high. That would open $0.1502 and then Saturday's $0.1639. A 4h close below $0.1132 would cancel it.
The downside case starts with a 4h close under $0.1132, which would put the $0.0968 low in play and then the gap floor at $0.0921. A 4h close above $0.1332 would take it off the table.
Bitcoin's close of $82,992 is above its rising 100-day average of $72,897, and MAGIC is inside its 20-day range. The evidence is balanced, with the held gap on one side and Saturday's long upper shadow on the other.
Funding on the perpetual printed negative on its last three readings, between minus 0.0451% and minus 0.1428%, listed here as a fact with no verdict attached. Every level in this MAGIC price analysis comes from Binance candles as of October 11, 2026, 09:00 UTC, and the next useful check is where Monday's daily candle closes against $0.1132.
Loading…
Written by
Writer and editor at Times of Crypto Era. Covers Bitcoin, DeFi, and market structure.
View full profile →Related News

LUMIA Price Analysis: A 108% Run Meets A Weekly Level At $0.1511
LUMIA price analysis: Lumia more than doubled in two days. See the daily structure break, the weekly level at $0.1511 and two scenarios with 4h triggers.

TIA Price Analysis: A Failed Sweep Became A 27% Breakout
TIA price analysis: Celestia swept a high, closed back inside, then jumped 27.3% on Oct 10. See the breaks, gaps and two scenarios with 4h triggers and levels.

CFX Price Analysis: Breakout On 9x Volume Meets The $0.0724 High
CFX price analysis: Conflux jumped 21.6% on Oct 10 on nine times normal volume. See the structure breaks, order block, fair value gap and two scenarios.