TIA Price Analysis: A Failed Sweep Became A 27% Breakout
TIA price analysis: Celestia swept a high, closed back inside, then jumped 27.3% on Oct 10. See the breaks, gaps and two scenarios with 4h triggers and levels.

In this article+
Celestia looked ready to roll over on Friday, and then it did the opposite. TIA wicked up to $0.5283 on October 9, above the $0.4915 swing high from October 2, and closed back at $0.4729. A day later it rose 27.3% to $0.6018, and this TIA price analysis maps what that sequence changed.
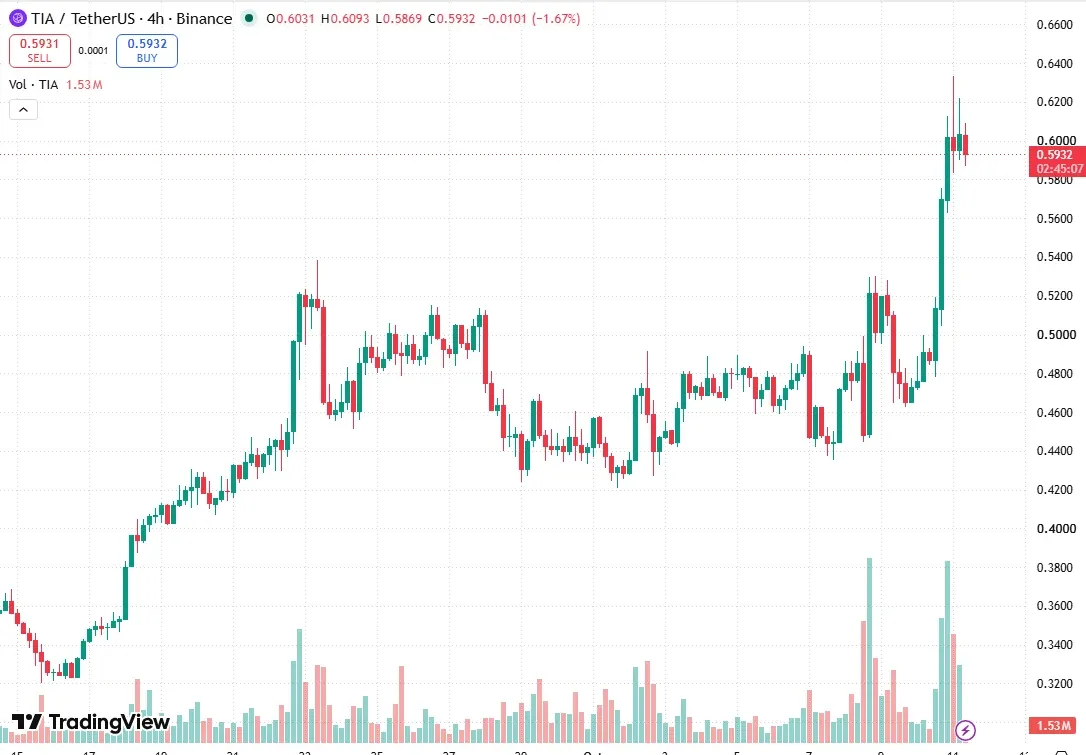
The TradingView four-hour TIA/USDT chart on Binance, with the October 10 expansion at the right edge.
TIA price analysis: the failed sweep and the break
A wick above a swing high that closes back inside is the classic buy-side sweep. It usually sets up a drop. This time the next candle ran straight through it, and the October 10 close of $0.6018 landed above the $0.5382 swing high from September 23. That was a bullish break on the daily chart, backed by $37.1 million of volume against a 20-day average of $19.1 million.
The weekly chart tells the same story at a larger scale. Structure flipped up in the week of May 4 on a close above $0.3876. The current week has now traded to $0.6333, well past the $0.5223 swing high from May 11.
Where TIA sits now
Sunday morning found TIA at $0.5916, easing off the day's high after the sprint. The daily EMA20 trails about a quarter below it, and the 50-day and 200-day averages are lower again, which is a wide gap for any chart. A chart this stretched often spends time digesting the move, and the gaps below are where that digestion would show up first.
Overhead, the daily chart shows a ladder of old swing highs, starting at $0.6257 from January and continuing through $0.659 and $0.699 from the end of last year. Underneath, the four-hour chart left a large fair value gap from $0.5195 up to $0.5627 and a smaller one just above it, which are the nearest places where unfilled buying could sit.
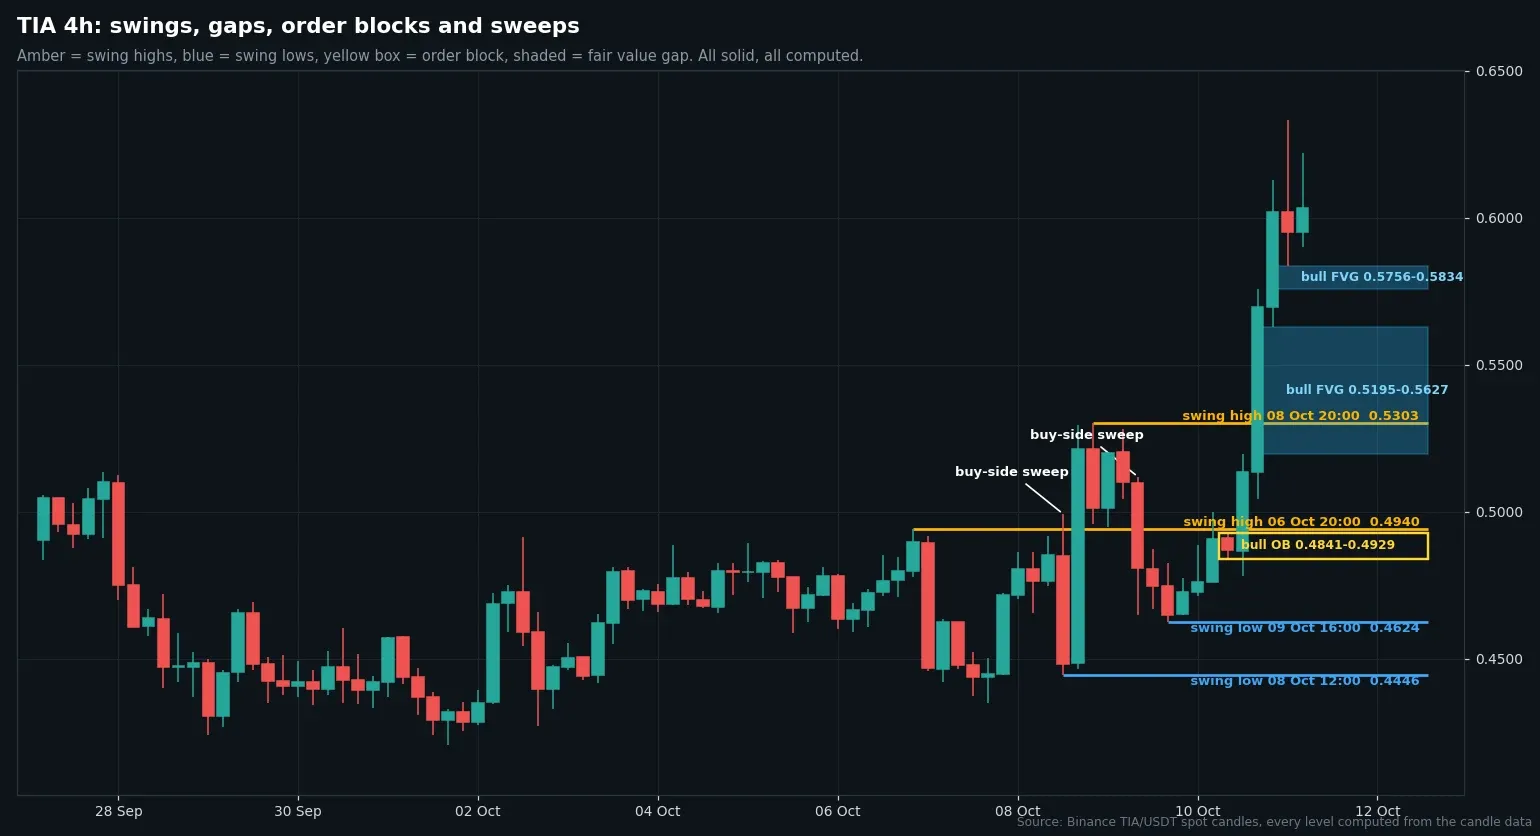
Four-hour candles with computed swings, order block and fair value gaps, from Binance TIA/USDT.
Two scenarios, with 4h triggers
The upside case needs a 4h candle to close above $0.6333, which is the day's high and also clears the January swing high. If that happens, $0.659 comes into view first and $0.699 behind it. Price closing back under $0.5756 on four hours would take that case off the table.
The downside case starts with a 4h close under $0.5627, which would pull price into the larger gap with $0.5195 as its floor, and a 4h close back above $0.6129 would cancel that idea before it develops.
Bitcoin's close of $82,992 is above its rising 100-day average of $72,897, and TIA is above its 20-day high, which counts as a breakout state. That regime tilts toward the upside, and the stretch above the averages is why the gap below matters.
All levels come from Binance candles as of October 11, 2026, 09:00 UTC, and they will shift as new four-hour candles close. This TIA price analysis reads structure and does not recommend a trade.
Loading…
Written by
Daniel Kiprop covers exchanges, listings, stablecoins and institutional crypto moves for Times of Crypto Era. Stories start from company filings and official announcements, not secondary coverage.
View full profile →Related News

LUMIA Price Analysis: A 108% Run Meets A Weekly Level At $0.1511
LUMIA price analysis: Lumia more than doubled in two days. See the daily structure break, the weekly level at $0.1511 and two scenarios with 4h triggers.

MAGIC Price Analysis: A 146% Spike Reversed 28% In One Hour
MAGIC price analysis: Treasure spiked to $0.1639 on Oct 10 and reversed 28.7% in one hour. See the structure, the held gap and two scenarios with 4h triggers.

CFX Price Analysis: Breakout On 9x Volume Meets The $0.0724 High
CFX price analysis: Conflux jumped 21.6% on Oct 10 on nine times normal volume. See the structure breaks, order block, fair value gap and two scenarios.