Sei DEX Volume Hits $15.9B All-Time, But One Venue Does 99% Of It
Sei DEX volume passed $15.9B all-time, but DefiLlama shows 30-day volume of $279M, about a fifth of the July 2025 peak, with Saphyre handling 99% of it.

In this article+
Cointelegraph noted on October 20 that Sei DEX volume had reached $15.9 billion over its lifetime. The milestone holds up. The DefiLlama page behind it also shows a network whose trading has shrunk a lot from its peak and now leans on a single exchange.
What the Sei DEX volume page shows
DefiLlama puts the last 24 hours at $6.62 million and the last 30 days at $279.36 million. The weekly change reads up 14.15%. We summed the tracker's daily series and got about $15.97 billion since the first trades, which agrees with the headline figure.
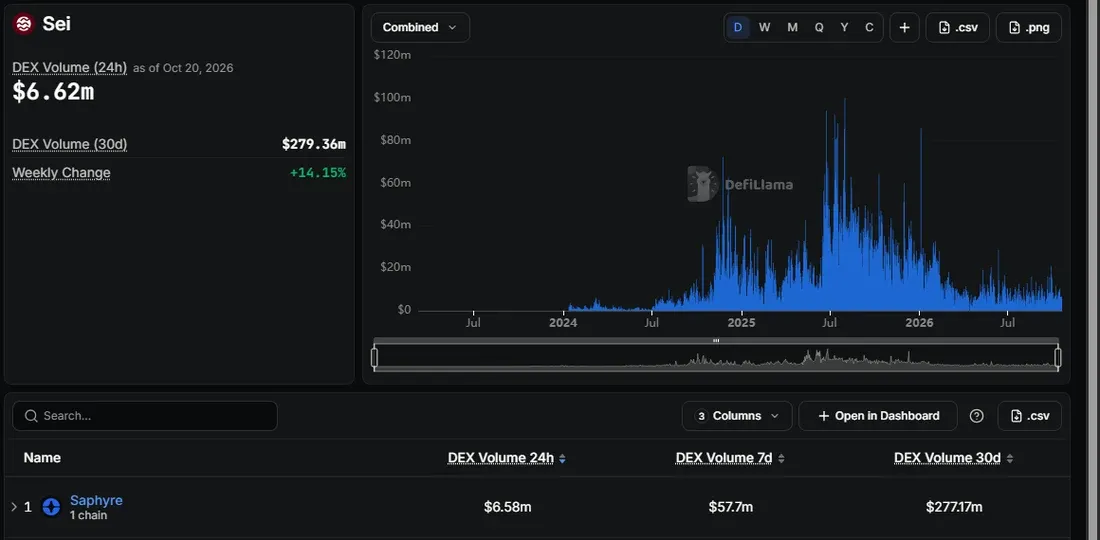
DefiLlama's DEX volume page for Sei on October 20. Source: DefiLlama.
The table underneath is lopsided. Saphyre is first with $277.17 million over 30 days and $57.7 million over seven. The next largest venue, Carbon Defi, shows $1.49 million over 30 days, and Uniswap on Sei shows about $647,000. By our math Saphyre handles roughly 99% of the chain's recent volume.
How far Sei DEX volume has fallen
The chain's best month was July 2025, at roughly $1.5 billion, with August not far behind. The biggest single day, August 1, 2025, passed $100 million. A normal day now is closer to $7 million.
From there the slide was steady. Monthly volume fell to about $750 million in November 2025 and under half a billion by February. April 2026 was the low, near $187 million. Since then every month has landed between roughly $220 million and $310 million. The latest 30 days, at $279 million, are about a fifth of the July 2025 peak.
Last year was far bigger than this one. Summing the daily data gives roughly $10.3 billion for 2025. For 2026 the running total is near $3.1 billion, with about ten weeks still to go.
Inside October the daily series swings in a fairly tight band. From October 5 to October 16 the tracker shows days as low as $5.3 million. The high was $11.9 million, on October 8. The weekly gain of 14% is a recovery inside that band and not a break out of it.
What the Sei DEX volume pattern shows
Concentration on one venue is the notable change in Sei DEX volume. Many Sei exchanges still appear in the table, but most of them show a few thousand dollars a day or nothing at all. Yei Finance sits at zero across all three columns on the page.
A page like this cannot say why traders went where they did, and we do not guess at causes. What it can show is the shape. Volume is down sharply from last summer, it has been fairly flat for six months, and one exchange now carries almost all of it. If a second venue climbed back above a few million dollars a month, that would be a visible change on the same DefiLlama table.
Sei DEX volume keeps adding to its all-time total either way, because every new trade adds to it. The $15.9 billion figure is a statement about the past, and the 30-day column is the better guide to where Sei trading stands today.
Loading…
Written by
Samiran is a well-known crypto writer and founder of Pressefy and News Coverage Agency, and a contributor at Hackernoon. He covers the crypto and blockchain industry with a focus on emerging projects, market trends, and the business side of Web3.
View full profile →Related News

Spark Risk Curation Vote: Curators Could Cut Risk Without A Poll
Spark risk curation vote SAEP-24 would let curators cut caps without a poll. It runs to October 22 beside a ratification of a Safe that differed from its poll.

Phala Cloud Attack: Post-Mortem Shows 17.5 Hours Before Detection
Phala Cloud attack post-mortem: attacker read some customers' logs and secrets for hours before detection. Here is what Phala says was and wasn't reached.

OSMO Price Analysis: A $0.0649 Sweep Fades On A 138M-Token Day
OSMO price analysis: a $0.0649 sweep on October 19 faded to $0.0543 on 138.4M tokens. Levels, two Osmosis votes and four-hour scenarios for the next move.