Stellar Stablecoin Supply Hits $507M, With USDC 90% Of It
Stellar stablecoin supply reached $506.83M on DefiLlama, up 17% in a week, with USDC at 89.74% of the total after peaking near $521M on October 17 this week.

In this article+
Stellar's stablecoin supply has had a big week. The Stellar stablecoin supply is the number to watch, and DefiLlama lists the total at $506.83 million as of October 20. That is about 17% more than seven days earlier and nearly 35% more than a month ago. Almost all of the growth is USDC.
What the Stellar stablecoin supply page shows
DefiLlama puts USDC on Stellar at $454.8 million, or 89.74% of the total. YLDS is second at $25.23 million, followed by EUR CoinVertible at $16.88 million, EURC at $5.03 million and AUDD at $2.09 million. Valtorum USD adds roughly $1.1 million.
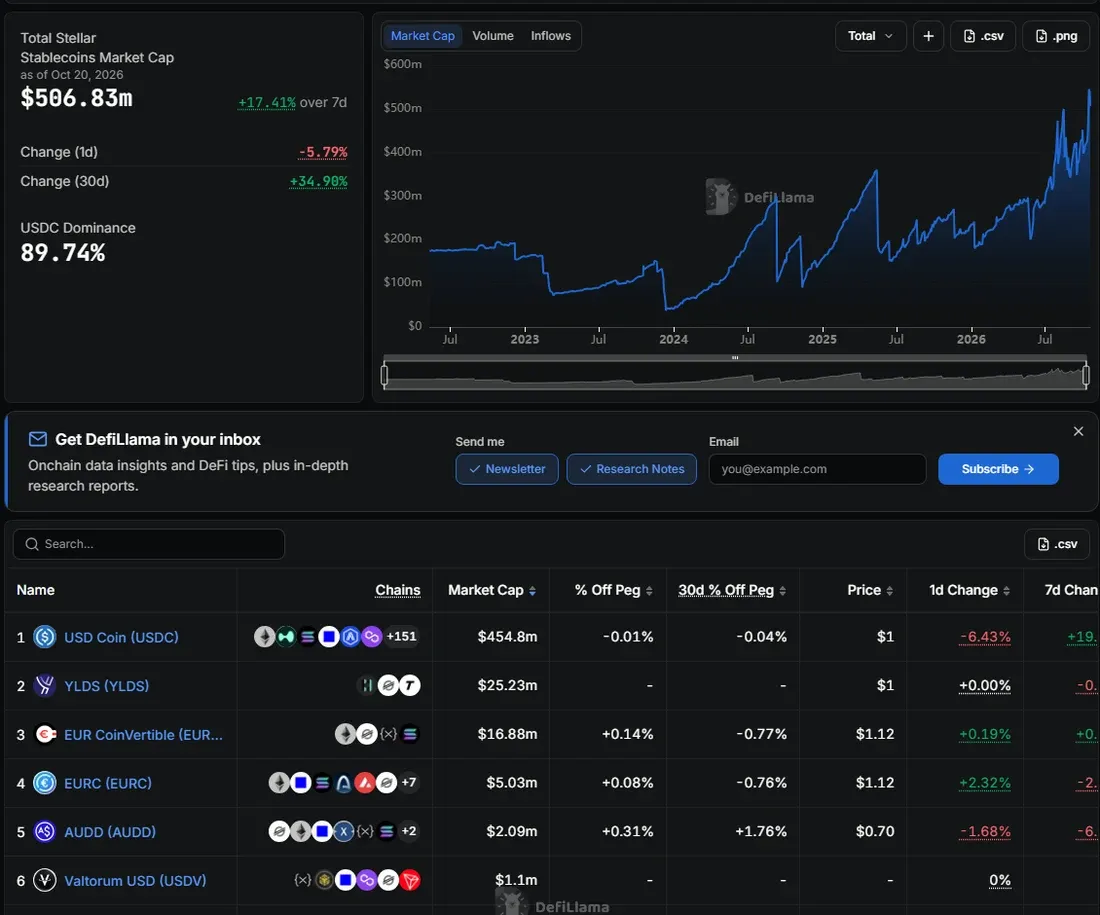
DefiLlama's Stellar stablecoin page on October 20, showing a total of $506.83 million. Source: DefiLlama.
The chart on the page has a staircase shape. Supply climbed through 2026 and has gone almost vertical over the last two weeks.
How the Stellar stablecoin supply moved day by day
We pulled the daily series behind the chart. Supply began October near $375 million and sat around $400 million on the 12th. Then it took off. Within five days it went past $456 million, then $499 million, and it topped out near $521 million on October 17.
Since then it has eased. The total held around $513 million on October 19. On October 20 the page shows a one-day drop of 5.79%, led by USDC. The newest day can still be revised as reports come in.
Taken together, the week looks like a jump of about $120 million in five days, followed by a partial pullback. That is a lot for a network whose stablecoin base was near $375 million at the start of the month.
Where Stellar ranks on stablecoin supply
Context helps. Stellar is a small player here. Of the 200 or so chains DefiLlama tracks, it ranks near 23rd for stablecoins, holding well under one fifth of one percent of the worldwide supply. Ethereum and Tron, by comparison, hold well over $100 billion each.
The mix is lopsided. Dollar coins make up nearly all of the Stellar stablecoin supply, and the euro and Australian dollar coins add up to under $25 million together. USDC's roughly 90% share is the number to keep an eye on if other issuers start to grow.
A contrast with Stellar's DeFi total
One other DefiLlama number points the opposite way. The chain's total value locked, which counts assets deposited in its DeFi apps, started the week above $250 million. By October 20 it sat nearer $230 million, about 8% lower. So more stablecoins sit on Stellar while less value is parked in its apps. The two figures measure different things, and the DefiLlama chain page lets you compare them.
How to check the figures yourself is simple. Open DefiLlama's stablecoins section, pick Stellar from the chain bar and sort the table by market cap. The headline box shows the total and its one-day, seven-day and 30-day changes, and the chart can be switched to inflows.
The next few days will show how to read this. If the figure keeps sliding from the October 17 high, the week will look like a spike. If it holds above $500 million, it will look like a step up.
This article reports public tracker data and offers no investment advice.
Loading…
Written by
Amina Wanjiru covers crypto regulation and policy for Times of Crypto Era. The reporting follows SEC, CFTC and Federal Register actions, plus rules from regulators in the UK, EU and Asia, with a focus on what a new rule changes in practice.
View full profile →Related News

Babylon v4.6 Upgrade Brings Security Fixes, With Details Held Back
Babylon v4.6 upgrade proposal 26 cites important security fixes and sits at 100% yes. Details wait until after the upgrade at block 4,853,800 on October 22.

Celestia v10 Upgrade Went Live At Block 15,116,659, Adding Fibre
The Celestia v10 upgrade activated at block 15,116,659 on October 20, adding Fibre, a validator-served data availability protocol, plus node and RPC changes.

Filecoin Solstice Upgrade Went Live, Ending Fil+ For New Sectors
Filecoin Solstice upgrade went live October 19 at epoch 6470279: Fil+ datacap ends, new sectors get 10x power and block rewards split into three streams.