ZEC Price Analysis: Bulls Reclaim $1,250 Under A Bearish Block
ZEC price analysis after the October 20 push: a $1,296 high, a $1,257 close and a bearish block overhead, with 4h levels and two scenarios from closed candles.

In this article+
ZEC has spent almost two weeks bouncing under $1,350. This ZEC price analysis asks whether the push of October 20 changes that picture. It uses closed candles only. Prices come from 07:00 UTC on October 21, when ZEC traded near $1,270.
Where the bounce started
The low of this leg arrived on October 18, when ZEC dipped to $1,049 and recovered inside the day. A second probe through $1,099 was bought back as well. Not much happened on October 19 or in the early hours of October 20. Then the 12:00 UTC candle woke the chart up. It ran from about $1,138 to a high near $1,235 while trading roughly three times its usual 4h volume.
Buyers kept going. On October 20 the daily candle began near $1,152. It stretched to $1,280 and closed at $1,257. The midnight candle touched $1,296, the highest print since October 14.
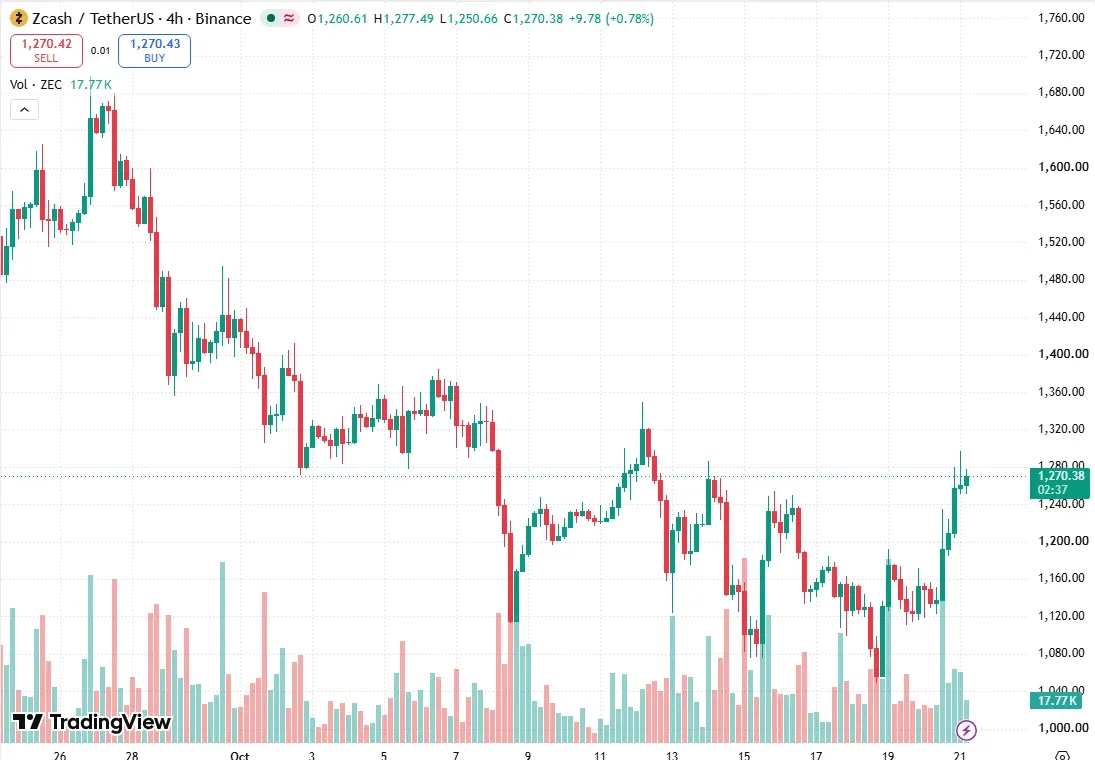
ZEC/USDT on the 4h chart at TradingView, read at 07:57 UTC on October 21. Source: TradingView, ZECUSDT on Binance.
What the ZEC price analysis shows on the 4h chart
A 4h close over the October 19 swing high, near $1,192, turned the short-term structure up on October 20. Two bullish gaps now sit below price. The nearer one sits between about $1,224 and $1,251, with the deeper one starting around $1,152. Price has not come back to fill either.
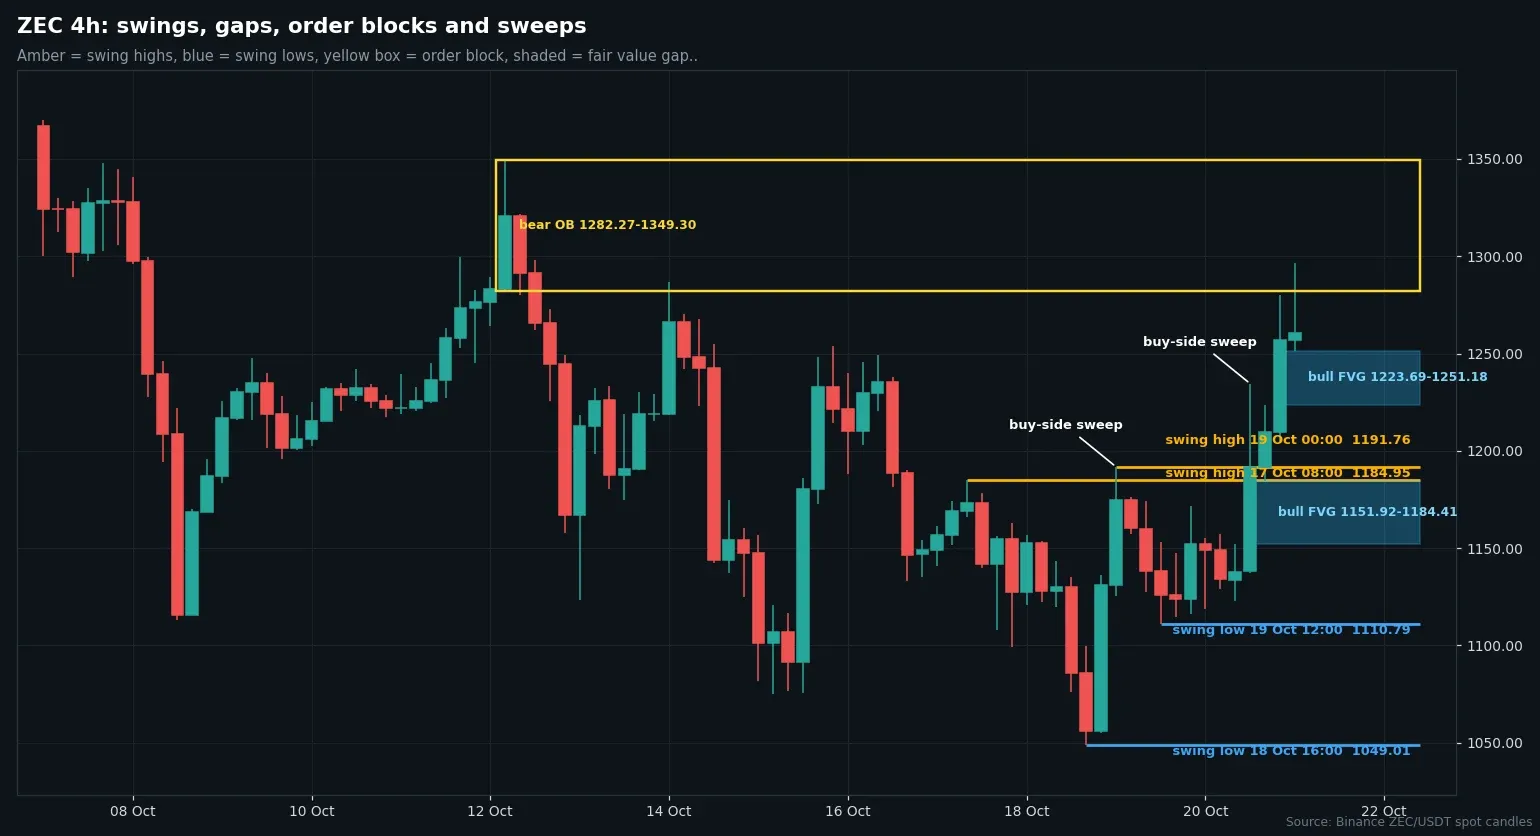
Four-hour candles from Binance with swing points, gaps and order blocks marked. Chart by Amina Wanjiru.
Volume tells a quieter story than the price. About 164,000 ZEC changed hands on October 20, a little under the 172,000 of the day before. So this was no burst of unusual trading. The rise built up over several 4h candles.
The daily picture is less settled. The daily trend turned down on October 8, when ZEC closed under $1,271. The October 20 close, $1,257, stopped just short of that line. The bigger structure has not flipped yet.
Price sits over both the 20-day exponential average and the 50-day. They are near $1,235 and $1,185. The 200-day is far below, close to $787.
The weekly chart still reads up, with a swing high at $1,698 from the week of September 21. At $1,270, ZEC sits about a quarter below that peak. This ZEC price analysis treats the weekly trend as background and the 4h chart as the working frame.
Overhead there is a bearish order block from the October 12 high, covering roughly $1,282 to $1,349. Beyond it come the October 6 high near $1,385 and the 20-day high at $1,450.
Two ZEC price analysis paths from here
The upside case starts with a 4h close over $1,296, the new local high. A close through $1,349 would then clear the whole bearish block and put $1,385 in view.
The downside case starts with a 4h close under $1,224, which empties the upper gap. That sends the test toward $1,185, where the 50-day average and the lower gap meet. A close below $1,110, the October 19 swing low, would cancel the bounce.
We have no lean here. Price is pressing into resistance after a fast move, and the larger daily trend still reads down. These ZEC price levels come from closed Binance candles and are not advice to trade.
Loading…
Written by
Amina Wanjiru covers crypto regulation and policy for Times of Crypto Era. The reporting follows SEC, CFTC and Federal Register actions, plus rules from regulators in the UK, EU and Asia, with a focus on what a new rule changes in practice.
View full profile →Related News

Balancer Wind-Down Gets Dates: Pools Pause Oct 30, DAO Ends In 2027
The Balancer wind-down now has a calendar. Pools pause October 30, the v3 vault stops November 30 and redemption starts May 31, 2027, per a forum spec.

Stellar Bell Upgrade Adds W Addresses And Post-Quantum Checks
The Stellar Bell upgrade, Protocol 30, adds W-prefixed contract addresses, ML-DSA checks and a millisecond ledger clock. Mainnet vote is set for November 23.

COMP Price Analysis: A $21 Low Turns Into A $29.30 Spike
COMP price analysis after the October 20 spike: a $21.00 low, a $29.30 high and a $25.92 close, with 4h levels and two paths to watch from the next candles.