Bitcoin Correlation With Stocks, Gold And Dollar Is Unusually Tight
Bitcoin correlation with stocks, gold and the dollar index checked against public prices: 90-day and 30-day readings agree with CryptoQuant's Quicktake.

In this article+
Bitcoin has been moving with the stock market and gold lately, while the dollar has gone the other way. A CryptoQuant Quicktake from analyst Crazzyblockk puts numbers on it, and a fresh calculation from public daily prices lands in the same place. The Bitcoin correlation with stocks, gold and the dollar is unusually tight for a stretch that includes a Fed rate hike. The tight Bitcoin correlation is the whole story here.
Correlation runs from minus one to plus one. At plus one two prices move in step, and at minus one they move in opposite directions.
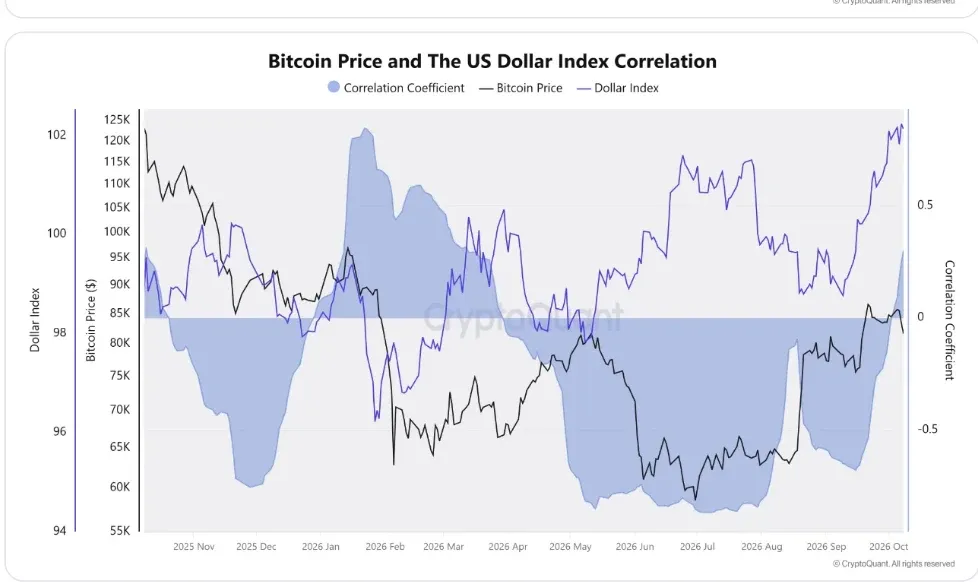
The bottom chart of the Quicktake from Crazzyblockk tracks Bitcoin against the US dollar index, with the correlation shaded behind the lines.
What the Quicktake measured
The Quicktake looks at the 90 trading days to October 8, 2026. It reports +0.42 with the Nasdaq, minus 0.36 with the dollar index and +0.51 with gold. Seeing all three at once is uncommon, the author says. In daily prices since 2014, that mix held on 11% of days, across three stretches.
It also gives the macro setting. The Federal Reserve raised rates on September 16, the 10-year Treasury yield is near a 24-year high, and the dollar is up 2.4%. Bitcoin is still up since June 12, which the author says these three markets largely do not explain.
Rebuilding the Bitcoin correlation from public prices
The same math can be run on public data. We took Binance daily closes for Bitcoin and Yahoo Finance daily closes for the indices and futures. For the 90 days to October 8, the dollar index came out at minus 0.36 and gold at +0.50, which is almost what the Quicktake shows. Stocks landed near +0.4 for both the Nasdaq 100 and the S&P 500. The Quicktake uses the Nasdaq Composite, which explains the small gap on that line.
Shorter windows are tighter. Over the 30 days to October 9, the Bitcoin correlation with equities was higher still, at +0.63 against the S&P 500 and +0.69 against the Nasdaq 100. Gold sat at +0.45, while the dollar link eased to minus 0.23.
None of this is fixed, and the Bitcoin correlation has swung a lot in either direction. The 30-day reading for the S&P 500 was close to zero in late August, at +0.08 on August 27, and had reached +0.67 in February. Gold ran from slightly negative on January 27 to +0.72 on September 17.
What the numbers do not say
Bitcoin trades around the clock, while stock indices close on US hours, so daily closes never line up perfectly. That timing gap can nudge any correlation in either direction. A correlation also says nothing about cause. Two prices can rise together because one drives the other, because a third force drives both, or by chance over a short window.
Prices give a plain backdrop for the Bitcoin correlation numbers, and they are easy to check. Bitcoin closed at $83,770 on October 12, up about 32% from $63,580 on June 12. The dollar index is near 102.2, up about 2.5% over the same span.
The Quicktake adds two cautions. The reading weakens if the correlations drift toward zero, and the three markets explain only about a third of Bitcoin's daily moves. This is a data summary and not advice.
Written by
Writer and editor at Times of Crypto Era. Covers Bitcoin, DeFi, and market structure.
View full profile →Related News

Bitcoin Whale Holdings Climb Above 3M BTC While Demand Lags
Bitcoin whale holdings climbed back above 3M BTC per CryptoQuant while apparent demand stays negative. See the charts, the supply in loss signal and caveats.

ETF Outflows Hit $1.2B For Bitcoin And Ether In One Week
ETF outflows reached $1.22B across bitcoin and ether funds in the week of Oct 5, with ether down nine sessions straight. See which funds lost most, day by day.

Bitcoin Funding Rate Turned Negative On Binance, Then Flipped Back
Bitcoin funding rate on Binance went negative Oct 5 to 8 but was not a nine-month low, per Binance's own history. See the prints, open interest and price.