Bitfinex ETH Longs Reach 283K, The Highest Since August 2022
Bitfinex ETH longs jumped from 96K to 304K in two days and sit near 283.5K, the highest since August 2022. See the sampled data and the price backdrop.

In this article+
Bitfinex ETH longs stand at about 283,500 ETH, and the last time they were higher was in the first week of August 2022. A Cointelegraph post on October 11 said the longs had hit their highest level in more than four years. Bitfinex's own public statistics agree with that, and they show how sudden the climb was.
How fast the Bitfinex ETH longs grew
Bitfinex publishes the size of open margin positions on ETH/USD through its public stats feed. Through the first days of October the long side hovered between roughly 100,000 and 110,000 ETH at noon UTC. By October 6 it had eased to about 96,000. Nothing in those readings hinted at what came next.
Then it took off. The next day's reading was about 193,500, and on October 8 it reached roughly 304,000, the highest sample of the run. The line has barely moved since. From October 9 through 11 the noon readings stayed pinned within about 100 ETH of each other. The morning of October 12 showed almost exactly the same number.
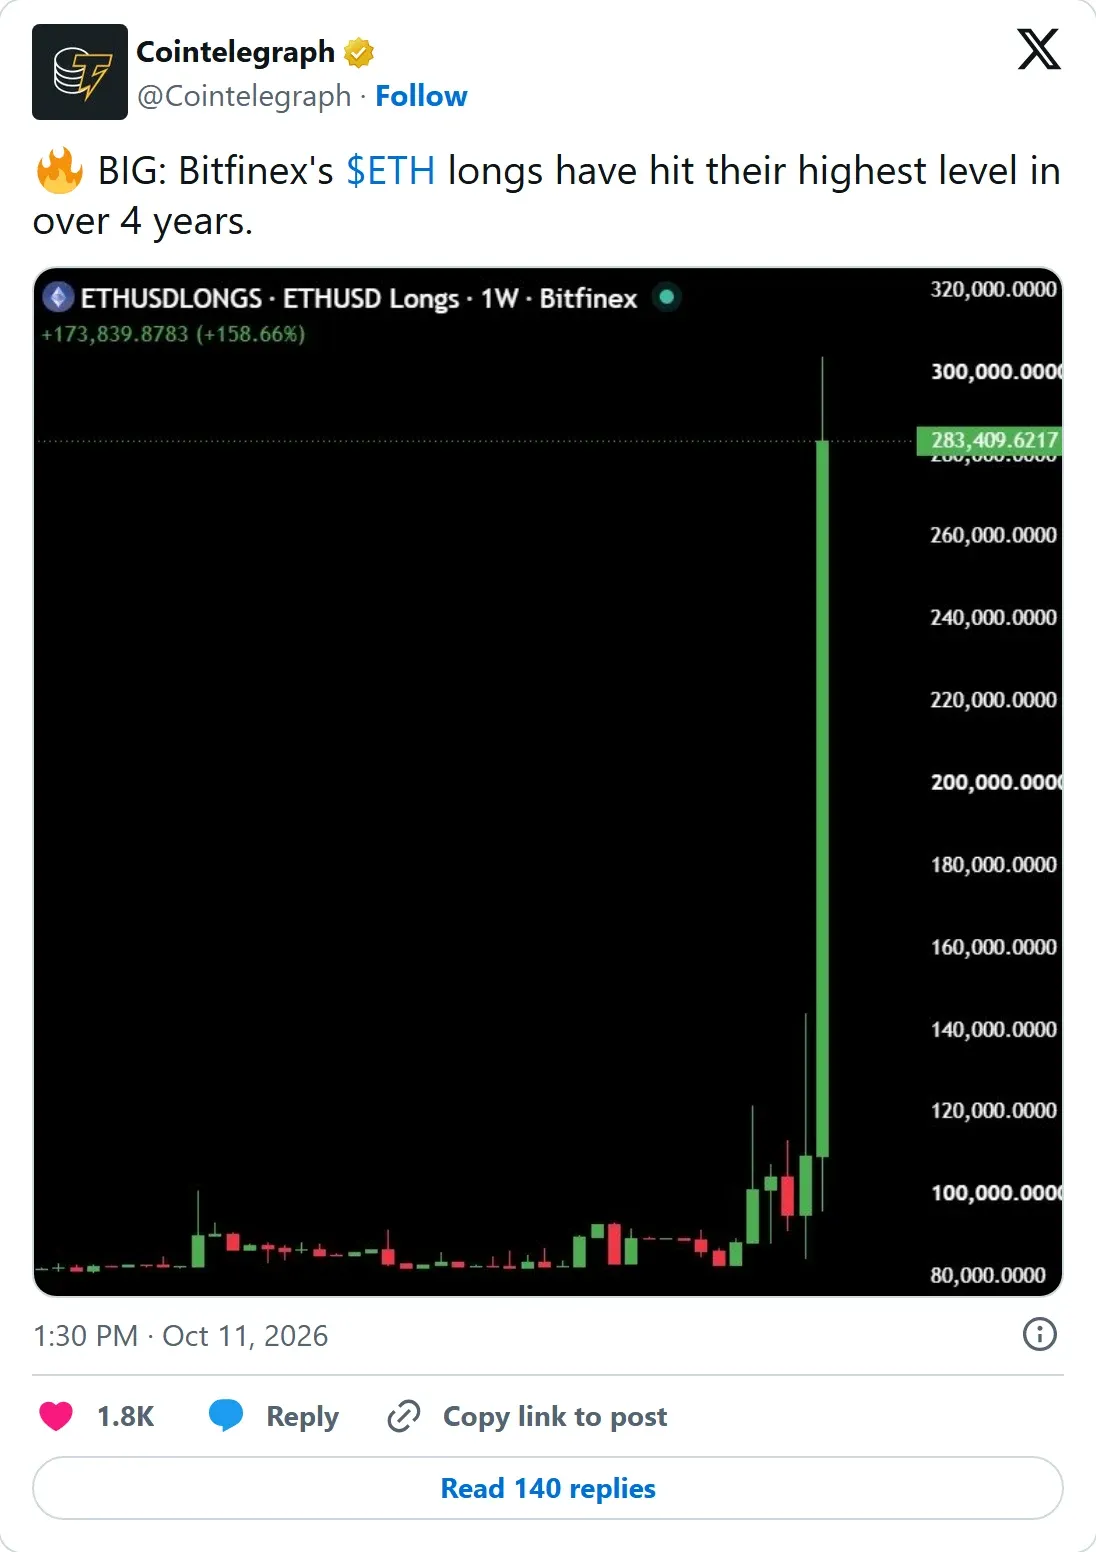
The Cointelegraph post carries a weekly chart of Bitfinex ETHUSD longs. It ends at 283,409.6 and marks a rise of 158.66% on the week.
How far back the record goes
To test the four-year claim, we sampled the same series every two days through August 2022. Early that month longs were far higher than today, near 440,000 on August 1. They slid to 362,000 by August 5 and to about 272,000 two days after that.
By August 9 the figure was down near 140,000, a fall of about two thirds in a week. So the last reading above today's level came around August 5 or 6, 2022. That is about four years and two months ago, which fits the post.
The short side and the price backdrop
The short side of the same feed tells a different story. Open shorts held near 10,500 ETH on October 6 and 7, and rose a little on October 8. Then they dropped hard. By October 9 only about 3,100 remained, and the October 11 reading was close to 3,500. That leaves the Bitfinex ETH longs at around 80 times the shorts.
What Ethereum did meanwhile
The jump arrived while the price was falling. ETH closed at $2,697 on Binance on October 6, then slid about 8% over two days to $2,475. After that it steadied, finishing October 10 at $2,507 and October 11 at $2,537.
A margin long is a bet on a rising price, placed with borrowed funds. The statistic adds up the open positions on one exchange. It does not say who opened them, or why, or whether any are hedged somewhere else.
The nearly identical readings after the peak are a fact about the data on Bitfinex ETH longs. The feed does not explain them. Anyone following this can watch whether the line holds near 283,500 or starts to fall. The same public feed can be queried at any time. This is a data summary and not investment advice.
Written by
Mwenda is a skilled crypto journalist and expert in blockchain technology, digital assets, and decentralized finance. He has a talent for translating complex concepts into engaging, informative content. With a deep understanding of the industry, Mwenda delivers accurate analysis that appeals to beginners and seasoned enthusiasts.
View full profile →Related News

STRK Price Doubles In Three Sessions After Starknet L1 Question
STRK price more than doubled in three sessions after StarkWare CEO asked if Starknet should become a layer 1. See the chart, volume, unlock date and caveats.

Binance ETH Reserves Hit A Six-Month Low As Withdrawals Spike
Binance ETH reserves fell to 3.47M ETH, a six-month low, as CryptoQuant counts a record 320,000 withdrawals on Oct 6. See the data next to ETF outflows.

ETH Taker Selling On Binance Hits -$2.3B As Open Interest Rises
ETH taker selling on Binance reached -$2.3B while price held near $2,570 and open interest rose 11.6%. Two CryptoQuant Quicktakes read the split differently.