ENA Lower Highs Press On The $0.1825 Low, Under Both Averages
ENA lower highs: four 4h bounces since Oct 14 each topped lower, down to $0.1926. A daily close at $0.1883 broke the $0.1941 low. See the levels and scenarios.

In this article+
Every bounce in Ethena's ENA since October 14 has topped out lower than the one before it. The ENA lower highs read $0.2145, $0.2085, $0.2011 and now $0.1926, each on a four-hour chart. At 08:23 UTC on October 18 the token traded near $0.1876 on Binance, not far above the $0.1825 low from October 15.
How the ENA lower highs stack up
The first of the four came at 08:00 UTC on October 14, when price touched $0.2145. Then the 08:00 UTC candle on October 16 reached $0.2085. Midnight on October 17 stopped at $0.2011. Midnight on October 18 managed just $0.1926.
Each failed push sits inside or close to a bearish order block. The chart marks two blocks. One spans $0.2094 to $0.2138 and the other $0.1965 to $0.2011. Traders read a bearish block as the spot where sellers last won control, and bounces tend to stall there.
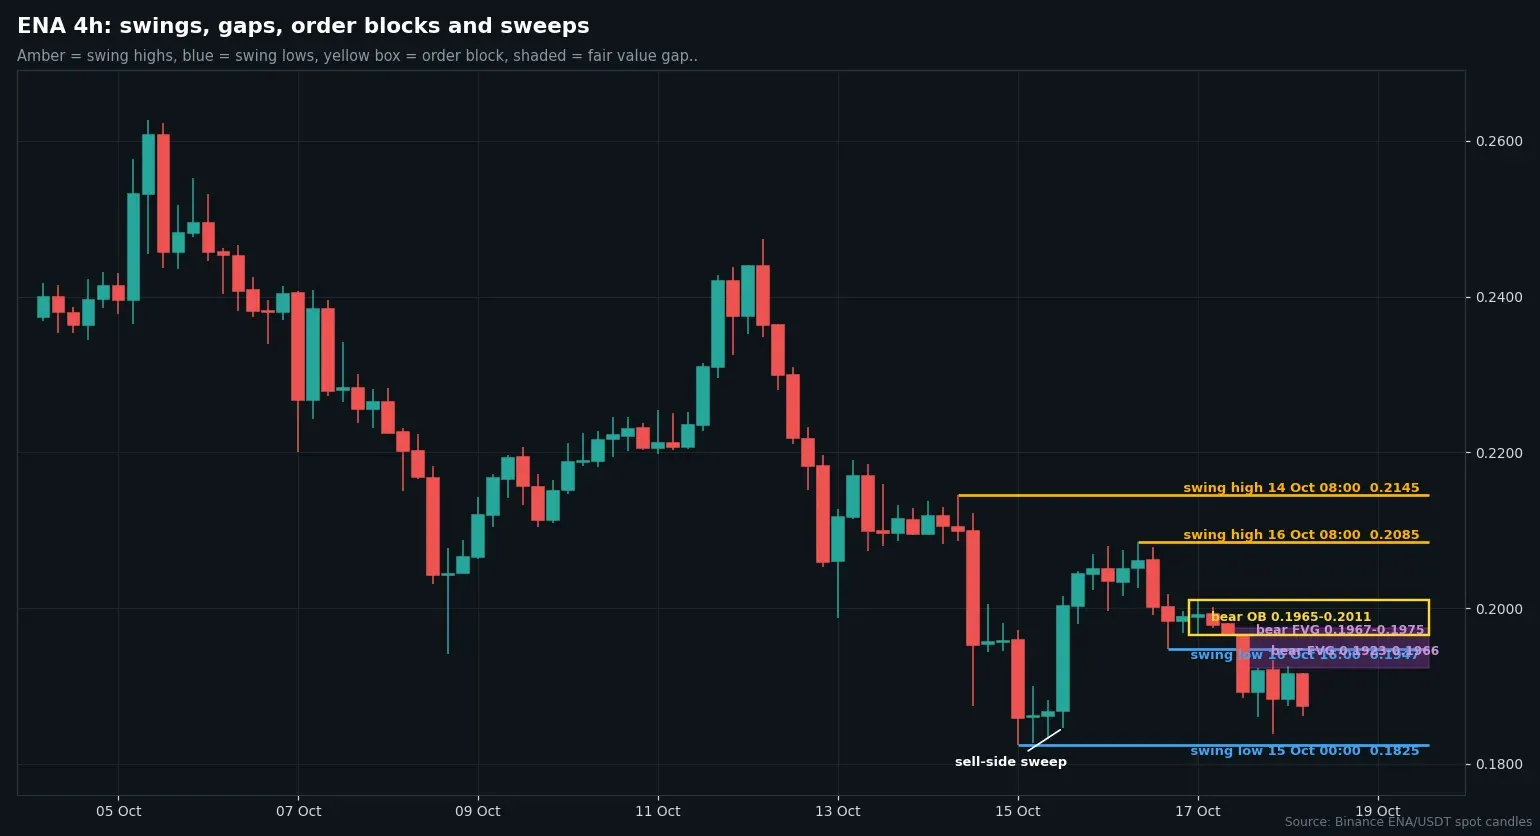
Four-hour ENA/USDT candles from Binance with swing points, bearish order blocks and fair value gaps. Chart by Daniel Kiprop.
The $0.1941 low and a daily close under it
The daily chart tells a related story. ENA made a low of $0.1941 on October 8. Price dipped below it on October 14 and again on October 15, down to $0.1825, and both days closed back above at $0.1958 and $0.2050.
That kind of move is called a sell-side sweep, and it often helps a low hold. It means a low got taken and buyers pushed price straight back. The ENA lower highs show that buyers lost the follow-through this time. Saturday's daily close of $0.1883 finished under the $0.1941 low, so the earlier sweeps no longer protect it.
Volume has faded along the way. The daily total was about 288 million tokens on October 15 and about 91 million on October 17.
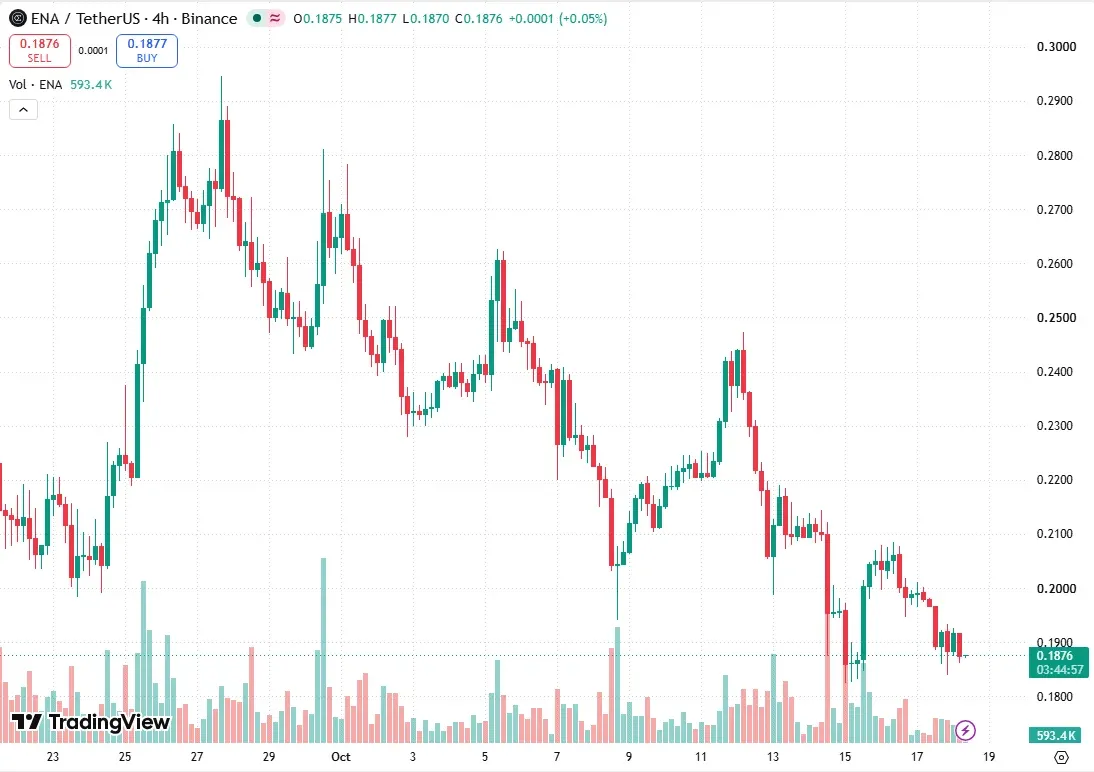
ENA/USDT four-hour chart on TradingView, captured at 08:23 UTC on October 18. Chart by Daniel Kiprop.
What the ENA lower highs mean for the bigger trend
The daily trend has been down since October 7. ENA now trades under its 20-day average near $0.214 and its 50-day near $0.196, and above its 200-day near $0.157. The weekly trend is still marked up, with the last weekly swing low at $0.1348 from the week of September 14.
CoinGecko lists ENA at about $2.51 billion in market value, rank 41. It shows a seven-day move of about minus 14.9% and a 30-day gain of about 10.8%.
Two scenarios for the ENA lower highs
The upside case needs a four-hour close above $0.2011, the top of the nearest bearish order block. That would break the run of ENA lower highs. The next reference would be the $0.2086 area.
The downside case starts with a four-hour close under $0.1825, the October 15 low. After that the chart has few marked levels until the weekly swing low at $0.1348. The case loses weight if price closes above $0.2011 first.
We have no lean on ENA. Every level here comes from closed candles, and none of it is advice to buy or sell the token.
Loading…
Written by
Daniel Kiprop covers exchanges, listings, stablecoins and institutional crypto moves for Times of Crypto Era. Stories start from company filings and official announcements, not secondary coverage.
View full profile →Related News

WLD Support At $0.4929 Breaks On The 4h, With The 50-Day Near $0.473
WLD support at $0.4929 broke on the 4h chart on Oct 17 and was probed twice since. See how Worldcoin sits against its 20 and 50-day averages and two scenarios.

PROM Daily Low At $4.80 Gets Swept Twice, Both On Heavy Volume
PROM daily low at $4.80 was swept twice in two days on heavy volume. See the 4h candles, bearish order blocks, averages and two close scenarios for Prom.

AVA Volume Spike: A 22x Candle Takes Travala's Token To $0.4227
AVA volume spike: a 22x four-hour candle on Oct 17 took Travala's token to $0.4227. See the order block, fair value gaps and two close scenarios for traders.