WLD Support At $0.4929 Breaks On The 4h, With The 50-Day Near $0.473
WLD support at $0.4929 broke on the 4h chart on Oct 17 and was probed twice since. See how Worldcoin sits against its 20 and 50-day averages and two scenarios.

In this article+
Worldcoin's WLD token has spent the weekend poking at one price. WLD support at $0.4929 gave way on the four-hour chart at 20:00 UTC on October 17, when a candle closed at $0.4925. At 08:21 UTC on October 18 the token traded near $0.4904 on Binance. That is a bit above its 50-day average and a bit below its 20-day.
The WLD support level that broke
The $0.4929 mark was the swing low from 16:00 UTC on October 16. It held through the 16:00 UTC candle on October 17, which dipped to $0.4866 and closed back at $0.5042. Then the 20:00 candle fell to $0.4780 and finished under the line.
That close is what traders call a break of market structure on the four-hour chart. It does not say the move down will continue. It only says the bounce from October 15 no longer holds. The WLD support line now has a failed close on its record.
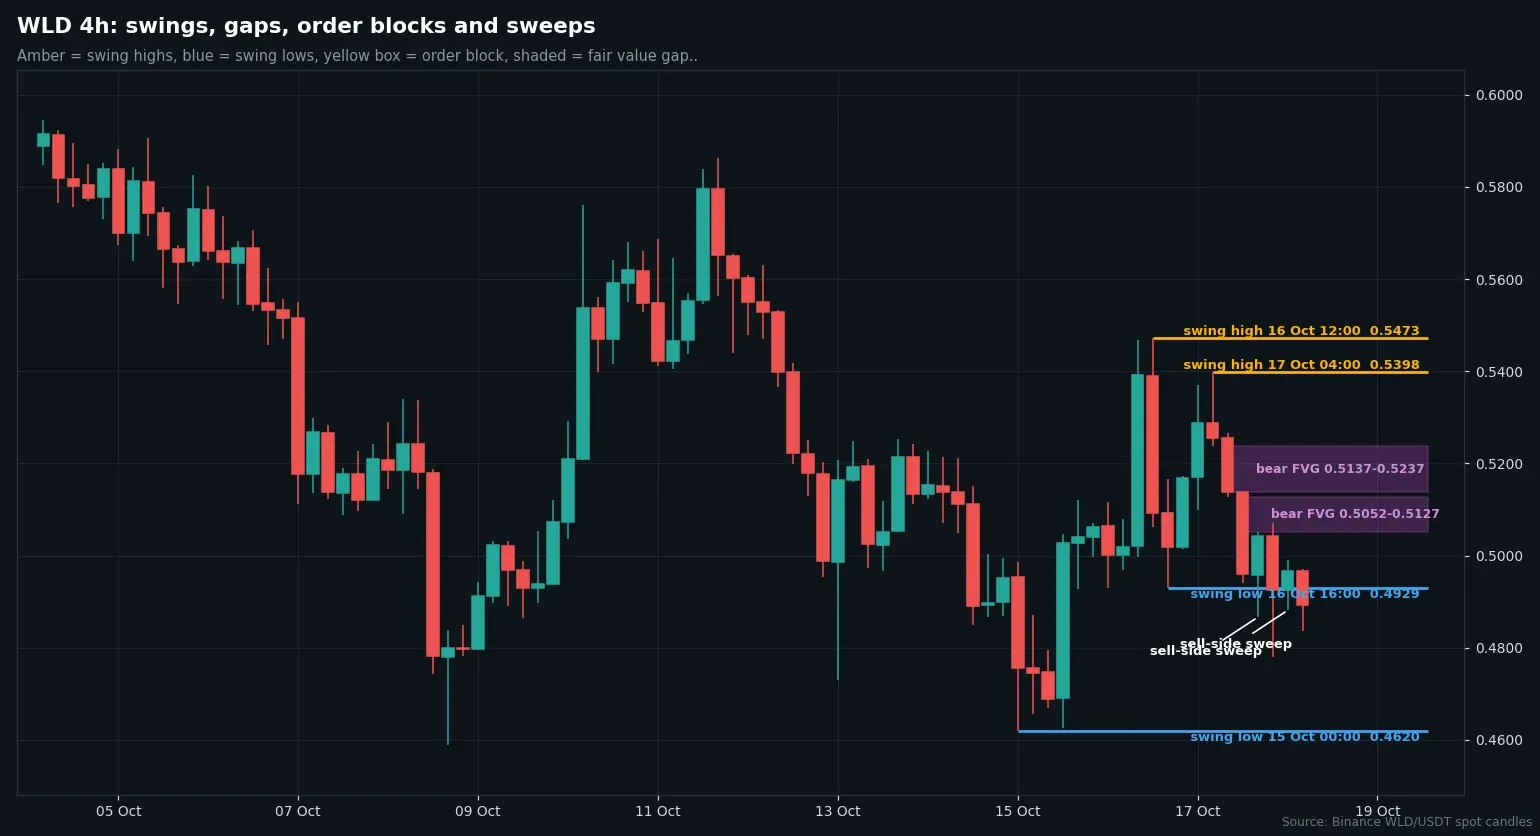
Four-hour WLD/USDT candles from Binance with swing points, sweeps and fair value gaps. Chart by Brian Otieno.
Two probes below the old WLD support
After the break, price revisited the WLD support area twice more. The 00:00 UTC candle on October 18 dropped to $0.4881 and closed at $0.4967, back above $0.4929. The 04:00 candle then made a low of $0.4836 and closed at $0.4892.
Those are not clean moves in either direction, and the old WLD support line now acts as resistance until a close says otherwise. Volume has been fading as well. The last three candles traded between 5.8 million and 9.2 million tokens, while the median four-hour candle over the last 120 holds about 11.9 million.
The busiest recent candle was the 08:00 UTC print on October 16. It reached $0.5467 on 35.6 million tokens, about 3 times the median, and has been fully given back.
Daily and weekly trend for WLD
The daily and weekly trends are both labelled up. On the daily chart the 20-day average sits near $0.510, the 50-day near $0.473 and the 200-day near $0.441. The last daily swing high is $0.5862 from October 11, and the daily low that matters most is $0.459 from October 8.
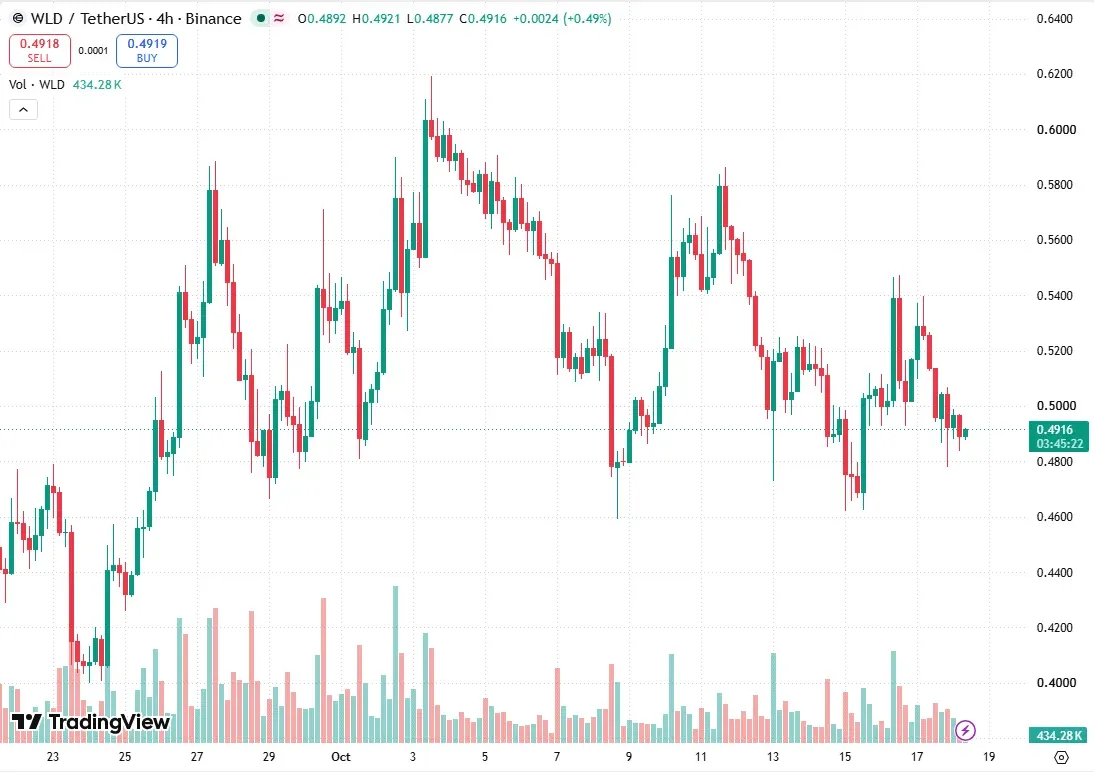
WLD/USDT four-hour chart on TradingView, captured at 08:21 UTC on October 18. Chart by Brian Otieno.
CoinGecko lists WLD at about $1.87 billion in market value, rank 53, with a 7-day move of about minus 10.2%. It shows a gain of roughly 13.5% over 30 days.
Two scenarios for WLD support
The upside case needs a four-hour close above $0.5127, the top of a bearish gap that formed on October 17 at 16:00 UTC. Above it, the next references are $0.5237 and the $0.5473 high from October 16.
The downside case starts with a four-hour close under $0.4780, the October 17 low. That puts the $0.473 swing low from October 13 and the 50-day average in range. It loses weight if price closes above $0.5127 first.
We have no lean on WLD. Every level here comes from closed candles, and none of it is advice to buy or sell the token.
Loading…
Written by
Brian Otieno reports on Bitcoin and Ethereum markets, spot ETF flows and derivatives data for Times of Crypto Era. Every figure in the pieces is checked against the live source before publishing.
View full profile →Related News

ENA Lower Highs Press On The $0.1825 Low, Under Both Averages
ENA lower highs: four 4h bounces since Oct 14 each topped lower, down to $0.1926. A daily close at $0.1883 broke the $0.1941 low. See the levels and scenarios.

PROM Daily Low At $4.80 Gets Swept Twice, Both On Heavy Volume
PROM daily low at $4.80 was swept twice in two days on heavy volume. See the 4h candles, bearish order blocks, averages and two close scenarios for Prom.

AVA Volume Spike: A 22x Candle Takes Travala's Token To $0.4227
AVA volume spike: a 22x four-hour candle on Oct 17 took Travala's token to $0.4227. See the order block, fair value gaps and two close scenarios for traders.