ENA Price Analysis: A Bounce Runs Into A Stack Of Overhead Levels
ENA price analysis from closed candles at 08:00 UTC on October 21: price sits inside a bearish gap near $0.204 with a 4h break up and two paths to watch.

In this article+
Ethena's ENA token has been grinding lower since late September. A bounce brought it back to about $0.204 at 08:00 UTC on October 21. That leaves it at a crowded cluster of overhead levels. This ENA price analysis lists those levels from closed candles and says what each side would have to do.
How ENA got here
The token peaked near $0.295 on September 27 and then made lower highs at $0.263 and $0.247. The daily structure broke down on October 7, when ENA closed under $0.228. Its low for the leg came on October 18 at $0.174, a dip that recovered within the same day.
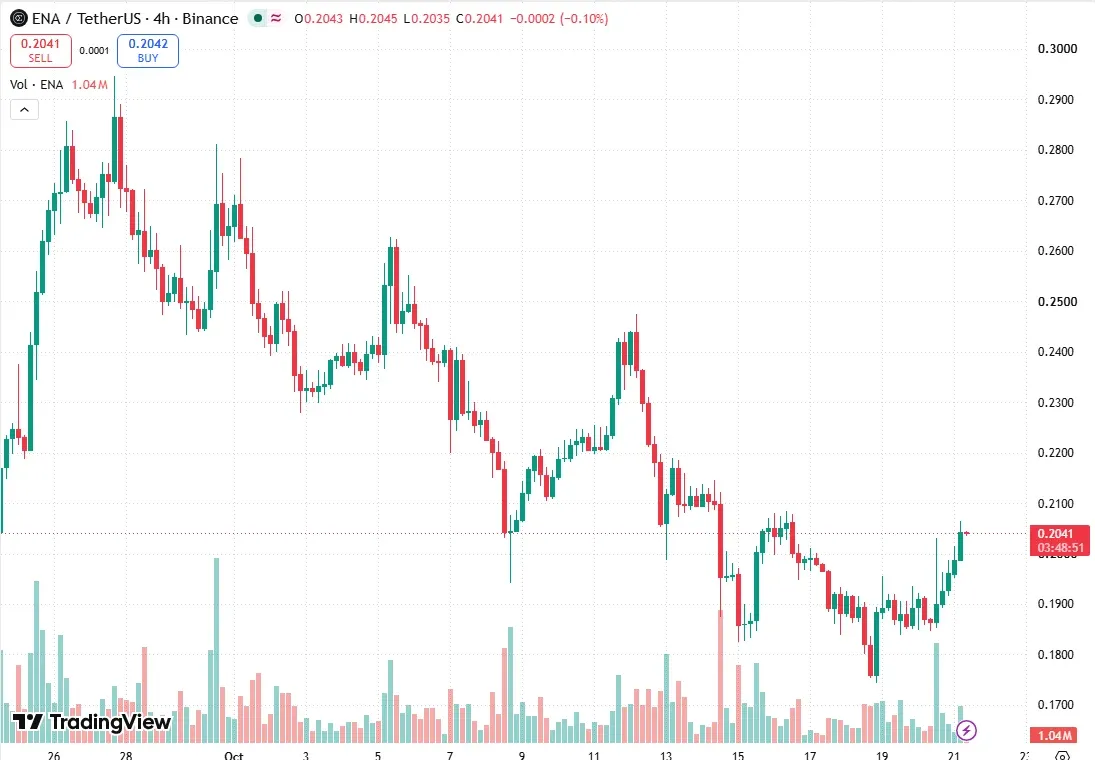
ENA/USDT on the 4h chart at TradingView, read at 08:11 UTC on October 21. Source: TradingView, ENAUSDT on Binance.
The turn came on October 20. The 12:00 UTC candle ran to $0.203 on about 94 million tokens, roughly four times the usual 4h volume. It faded to a close near $0.190, but the lows held, and later candles stepped up again. The October 20 daily candle opened near $0.189, reached $0.203 and closed at $0.196.
The ENA price analysis on the 4h chart
The 04:00 UTC candle on October 21 closed at $0.204, above the $0.203 high of the earlier spike. That gave a 4h structure break to the upside. Below price there are two small bullish gaps stacked together, running from about $0.184 up to $0.189. Neither has been tested since they formed.
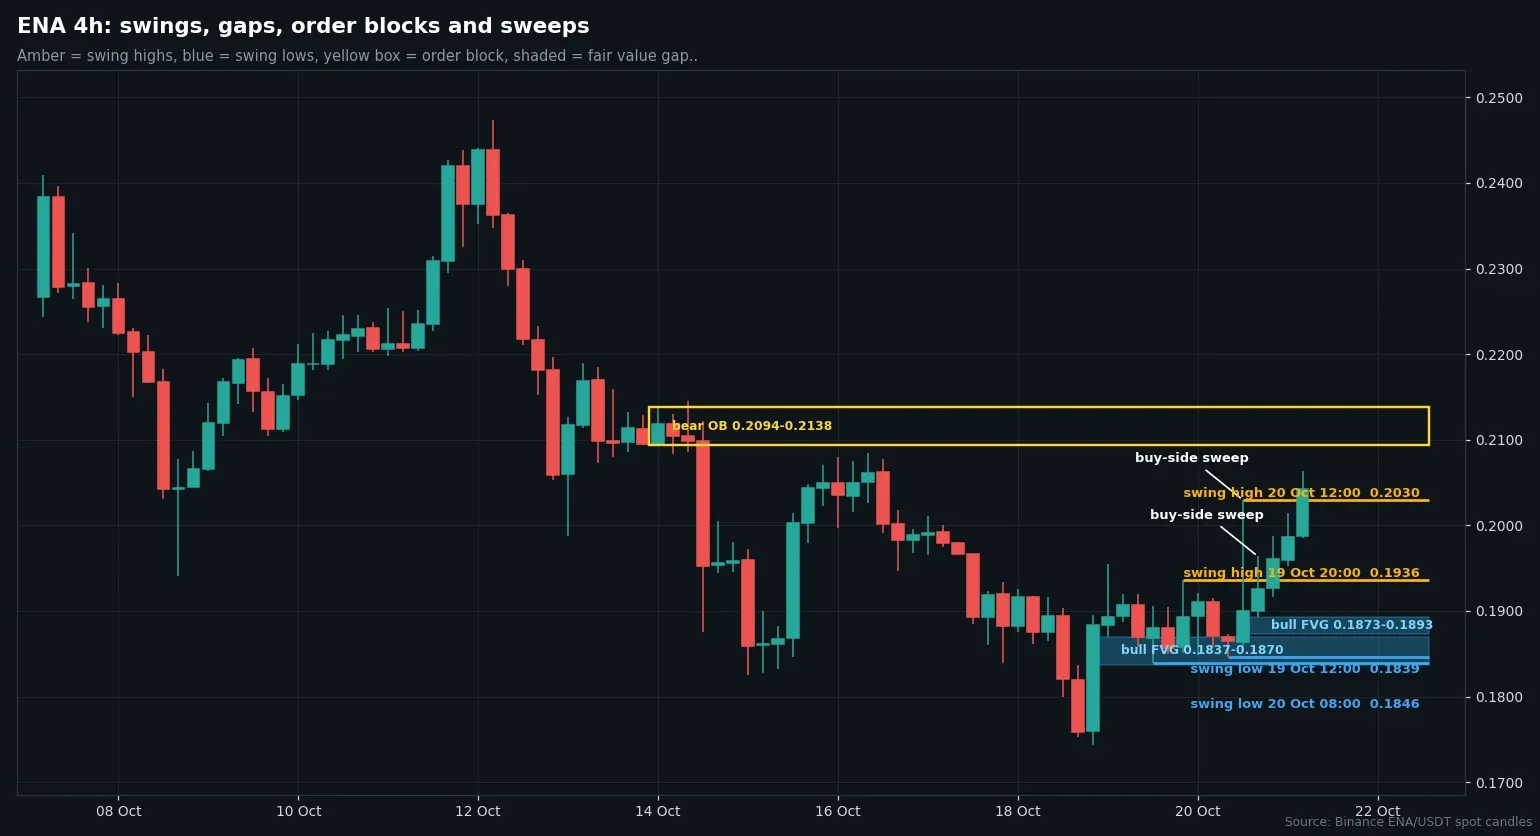
Four-hour candles from Binance, with swing points, open gaps and an order block drawn in. Chart by Faith Njeri.
Above price the ENA price analysis gets crowded. A bearish gap from October 14 runs from about $0.2005 to $0.2086, and ENA is trading inside it. Just above that gap sits a bearish order block from $0.209 to $0.214, and another bearish gap near $0.220 to $0.221.
The weekly chart still reads up. Its last swing low sits at $0.135 from the week of September 14, and the swing high is the $0.295 peak. The pullback of recent weeks is a retreat inside that larger range and not a break of it.
On the daily chart the trend still reads down. ENA is below its 20-day exponential average near $0.208 and above its 50-day near $0.195. The 200-day is far below, close to $0.158. TradingView showed the token down about 2.6% over a week and 5.9% over a month, but up about 126% over three months.
Two ENA price analysis paths
The upside case needs a 4h close over $0.2086, the top of the October 14 gap. That would put the order block up to $0.214 in play, with the gap near $0.221 as the next reference.
The downside case begins with a 4h close back under $0.2005, which would show buyers failing inside the gap. A close under $0.189 would empty the nearer bullish gaps, and a close below $0.174 would take out the October 18 low.
We have no lean either way in this ENA price analysis. ENA is pressing into a stack of resistance while the daily trend remains down. These levels come from closed Binance candles and are not advice to trade.
Loading…
Written by
Faith Njeri covers DeFi protocols, exploits and onchain security for Times of Crypto Era. Project post-mortems and governance proposals are read in full, and each incident is traced back to the team's own disclosure.
View full profile →Related News

Ondo Stocks On Solana Reach 1inch, But Issuer Rankings Differ
Ondo stocks on Solana reached 1inch on October 20. RWA.xyz data on October 21 ranks Ondo second among tokenized-stock issuers, not first as the post says.

IOST Price Analysis: Volume Jumps 66x As IOST Climbs 70%
IOST price analysis after the October 19-21 surge: huge volume, a staircase of higher 4h closes near $0.00127 and two scenarios taken from closed candles.

Qubic Weak Seeds: Wallet Used Math.random Before The 4.26.4 Fix
The Qubic weak seeds problem traced to Math.random in the wallet. A fix shipped October 18, the network restarted, and a claim window runs to May 1, 2027.