EPIC 54% Drop Meets A 31% Rebound On 90x Candle Volume
EPIC 54% drop: from $0.4593 to $0.2113 in two days, then a 31% four-hour rebound on 90x volume. Key levels, fair value gaps and two 4h-close scenarios.

In this article+
EPIC lost more than half its value in about two days. Then it came roaring back with a 31% single candle. The EPIC 54% drop started at $0.4593 on October 14 and bottomed at $0.2113 on October 16. At 16:00 UTC on October 17 the token was changing hands near $0.30 on Binance, still a third below where the slide began.
How the EPIC 54% drop unfolded
It was a sleepy market until the 04:00 UTC candle on October 14. The candle before it traded only about 85,000 tokens. That one hit 5.5 million, printed the $0.4593 high and dropped as far as $0.3698.
Sellers did not stop there. By the 16:00 candle price had touched $0.2598, and a bounce at 20:00 faded well short of the old $0.46 area. A second leg on October 15 reached $0.2262. The bottom came at 08:00 UTC on October 16.
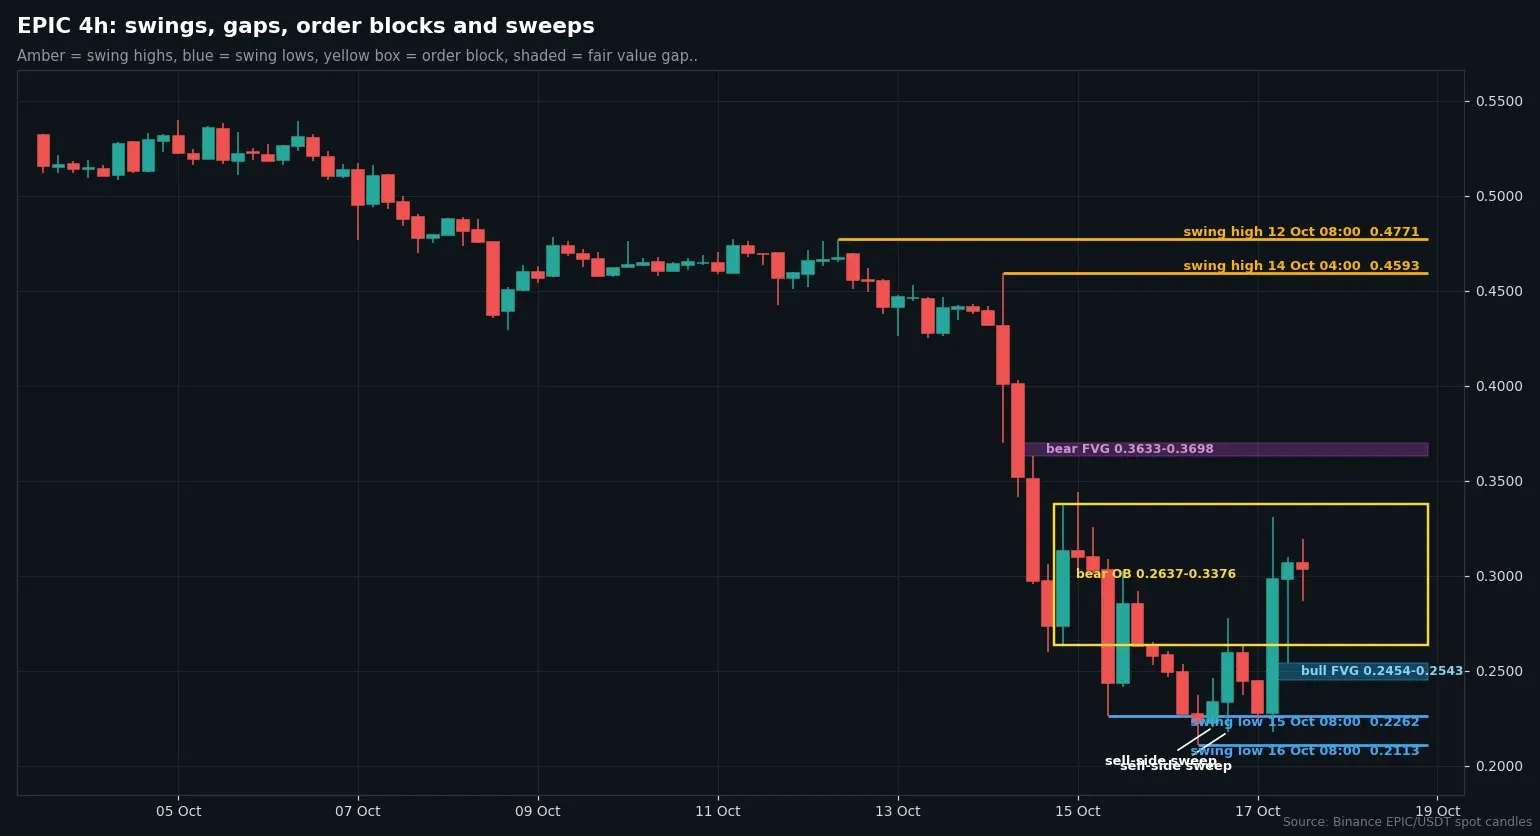
Four-hour EPIC/USDT candles from Binance with swing points, an order block and fair value gaps. Chart by Mwenda.
What the EPIC sweeps looked like
The $0.2262 low became the level to watch. The 08:00 candle on October 16 closed under it, at $0.2225, which looked bad. Two candles later, though, price poked under again to $0.2203 and then $0.2178, and both times it closed back above $0.2262.
Traders call that a sell-side sweep. It means a low got taken out and buyers pushed price straight back. It is not proof of a bottom, only a sign that someone was buying at the lowest prints.
A candle 90 times the usual size
Then came the 04:00 UTC candle on October 17. It opened at $0.2277, spiked to $0.3308 and closed at $0.2985, a gain of 31% for the candle. About 15.4 million tokens changed hands in it. The median four-hour candle over the last 120 holds roughly 172,000, so this one was close to 90 times normal.
The next two candles held the gains, closing at $0.3068 and $0.3036. Both sit inside a bearish order block that stretches from $0.2637 up to $0.3376.
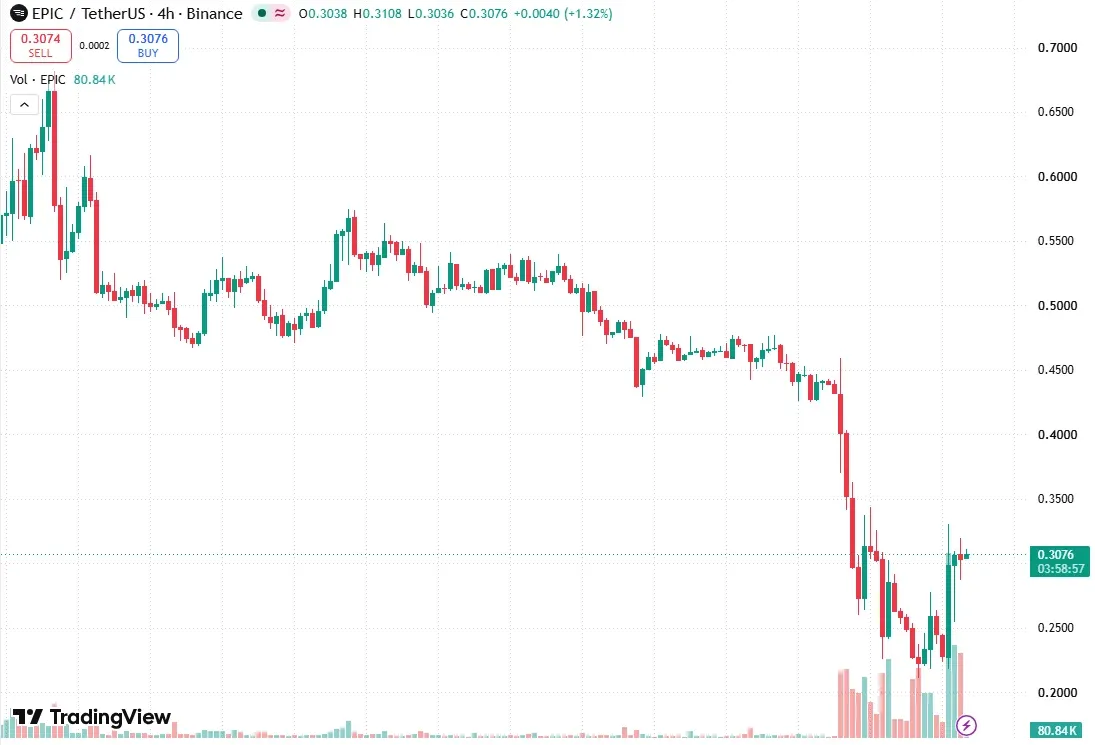
EPIC/USDT four-hour chart on TradingView, captured at 16:01 UTC on October 17. Chart by Mwenda.
EPIC on the daily and weekly charts
Zoom out and the EPIC 54% drop looks worse. The daily trend flipped down on October 8, and price sits far below its 20-day average near $0.42 and its 200-day near $0.48. The weekly trend still counts as up, but EPIC now trades under its August 17 swing low of $0.32. TradingView lists the token down about 34% on the week.
Two scenarios for EPIC
After a move that size there are two paths. The hopeful one needs a four-hour close above $0.3376, the top of that order block. Next in line would be a bearish gap from $0.3633 to $0.3698.
The cautious one starts with a four-hour close under $0.2454. That fills a bullish gap and puts the two October 16 lows back in play. It loses weight if price closes above $0.3376 first.
We have no lean either way. Every level here comes from closed candles, and none of it is advice to buy or sell EPIC.
Loading…
Written by
Mwenda is a skilled crypto journalist and expert in blockchain technology, digital assets, and decentralized finance. He has a talent for translating complex concepts into engaging, informative content. With a deep understanding of the industry, Mwenda delivers accurate analysis that appeals to beginners and seasoned enthusiasts.
View full profile →Related News

SAND Volume Spike: One Candle Trades 114M Tokens In A 20% Rebound
SAND volume spike: the 12:00 UTC four-hour candle traded 114M tokens, nearly nine times the median, as price rebounded 20% from $0.0528. Levels and scenarios.

Marqeta Coinbase Stablecoin Cards: Base Handles The Settlement
Marqeta Coinbase stablecoin cards: Coinbase handles custody and conversion, Base settles, and Marqeta issues and processes. Announced Oct 16, no launch date.

FIL Price Analysis: A Sweep To $0.9999 Reverses To $1.2013
FIL price analysis: a sweep to $0.9999 on Oct 15 reversed to a $1.2013 high, and FIL sits near $1.13. A bullish gap at $1.0804 to $1.1317 is below price.