FIL Price Analysis: A Sweep To $0.9999 Reverses To $1.2013
FIL price analysis: a sweep to $0.9999 on Oct 15 reversed to a $1.2013 high, and FIL sits near $1.13. A bullish gap at $1.0804 to $1.1317 is below price.

In this article+
Filecoin took a dive to $0.9999 on October 15, then turned and finished the day at $1.1608. It was a quick change of mood, and the high of the day reached $1.2013. This FIL price analysis uses closed Binance candles through 16:00 UTC on October 16.
The reversal in the FIL price analysis
Look at the 12:00 UTC four-hour candle first. It slid under the October 13 swing low near $1.07 and closed back above it, at $1.0785. About 4.35 million FIL changed hands, around twice the usual four-hour volume of 2.13 million.
Buyers took over from there. The next candle gained 6.1%, and the one after it ran up to $1.2013 before it settled at $1.1608. That 20:00 UTC candle traded 6.31 million FIL, roughly three times the median.
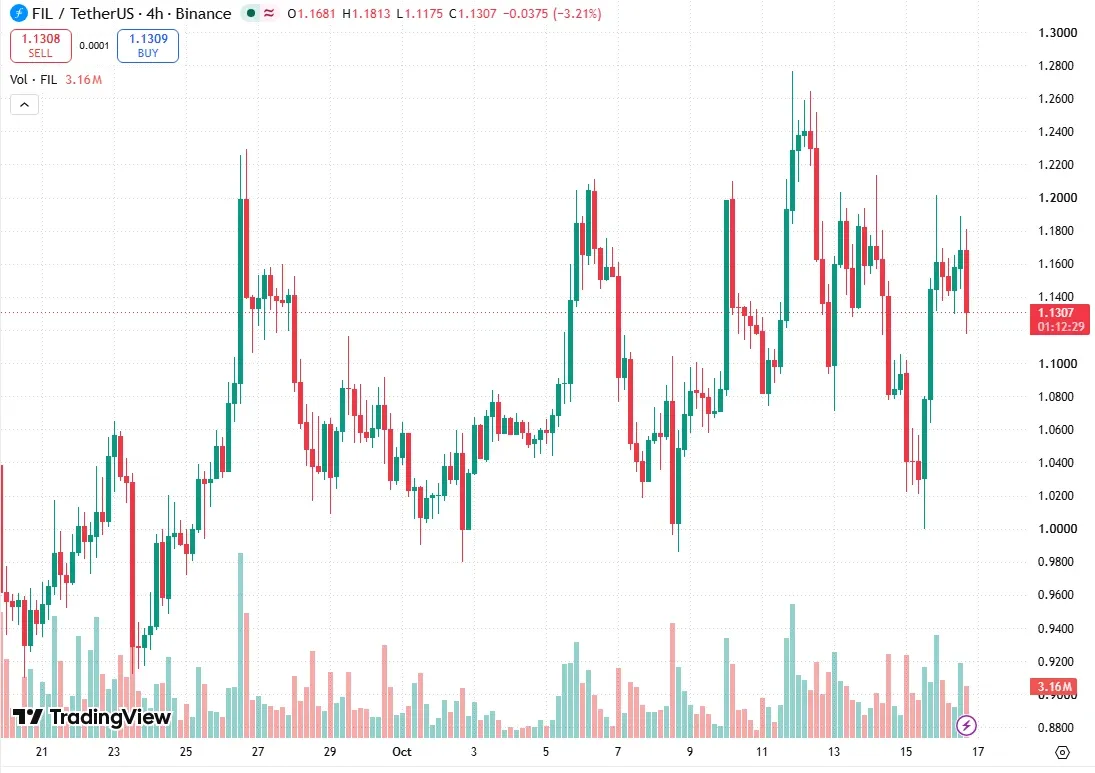
FIL/USDT four-hour chart on TradingView, captured at 18:47 UTC on October 16. Chart by Amina Wanjiru.
The TradingView panel also showed a news item from five hours earlier. Its headline said Filecoin would roll out tokenomics changes in October. Timing alone does not show a cause, so this article does not tie that headline to the candles.
Daily structure for FIL
The daily trend is up. FIL broke structure upward on August 21. Its swing lows have risen since mid-September, and the latest is $0.9858 on October 8. The daily candle on October 11 reached $1.2764, the highest of the last 20 days, and it has not been retested.
Price sits above every daily average that matters here. The 20-day is near $1.09, and the 50-day and 200-day both sit just under $1, around $0.98 and $0.96. The weekly chart is less friendly. Its trend is still down, and the last weekly swing high is $1.324 from early May.
Gaps and levels around FIL price
The sweep left a bullish four-hour gap, an empty space left by a fast rise, from $1.0804 to $1.1317. A smaller one spans $1.0568 to $1.0638. Price is trading at the upper edge of the larger gap now, and the 16:00 UTC candle is still open.
Overhead, a bearish four-hour gap spans $1.1857 to $1.2190, formed on October 12. Swing highs stack at $1.2013, $1.2139 and $1.2764. Underneath, the $0.9999 low from October 15 is the first line, followed by the $0.9858 daily swing low.
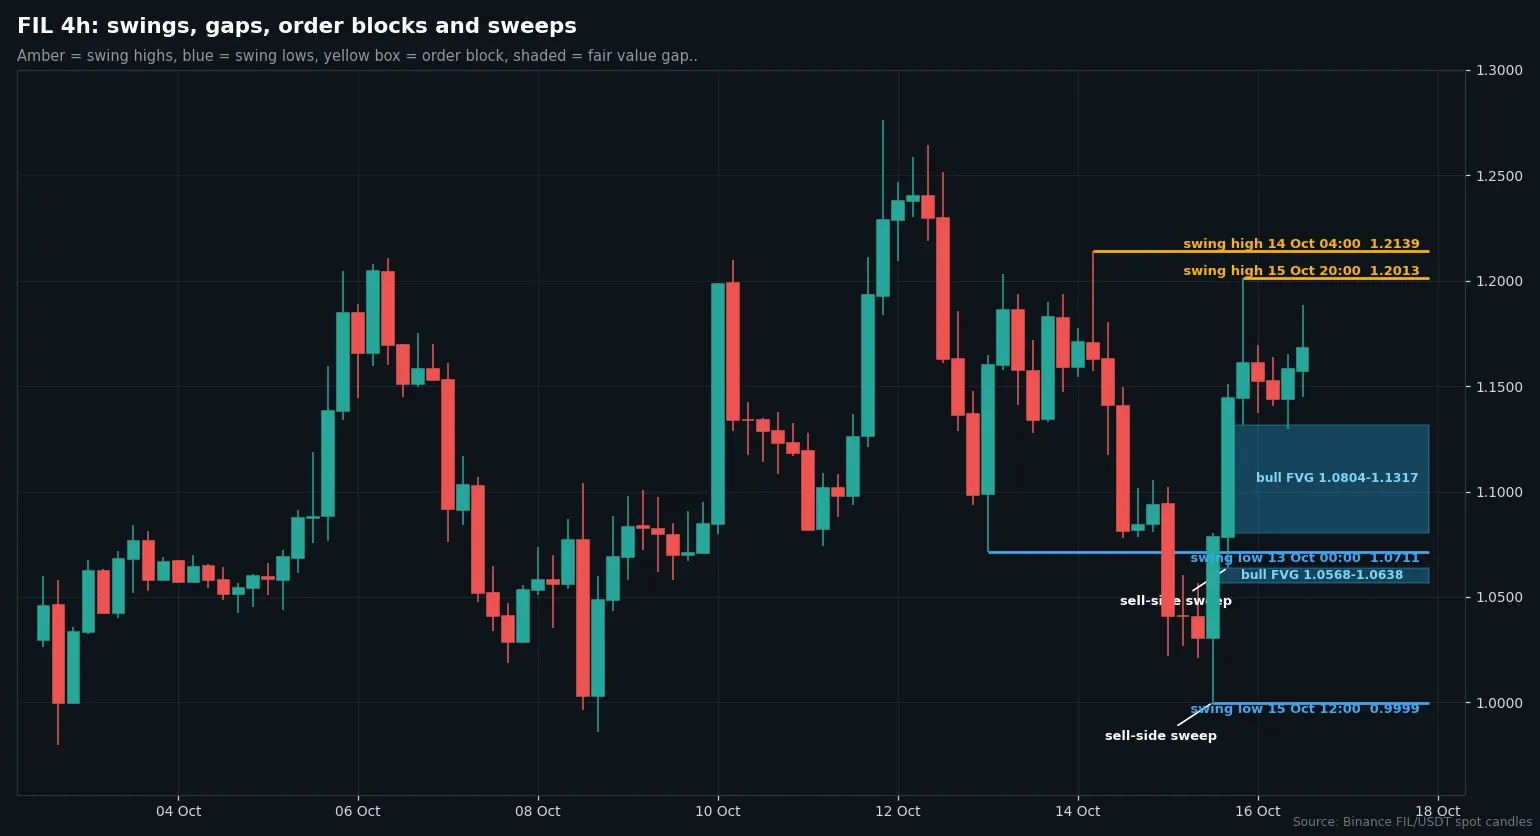
Four-hour FIL/USDT candles from Binance, with swing points and fair value gaps. Chart by Amina Wanjiru.
Two scenarios for FIL
The constructive case needs a four-hour close above $1.2190, the top of the bearish gap. That would put the $1.2764 swing high in play. Holding above the bullish gap's lower edge near $1.0804 keeps the October 15 sweep intact as a reversal.
The cautious case starts with a four-hour close under $1.0711, the October 13 swing low that the sweep took out. A close below $0.9999 would open the $0.9858 daily low and the 50-day average near $0.9828. Both ideas lose weight if price closes back through the $1.0804 to $1.2190 band.
We have no lean. This FIL price analysis describes candles that already closed and is not advice to buy or sell.
Loading…
Written by
Amina Wanjiru covers crypto regulation and policy for Times of Crypto Era. The reporting follows SEC, CFTC and Federal Register actions, plus rules from regulators in the UK, EU and Asia, with a focus on what a new rule changes in practice.
View full profile →Related News

Aave V4 Tempo Proposal: One Hub, Two Spokes And OUSD Borrowing
The Aave V4 Tempo proposal asks for one liquidity hub, two spokes and OUSD, cbBTC and PRIME. A July Temp Check drew 392,686 in voting power for, none against.

XRP Price Analysis: A Sweep To $1.2840 Fades Back Toward The Low
XRP price analysis: two sweeps under $1.3112 on Oct 15 reversed, then XRP slid to $1.296. A four-hour gap at $1.3448 to $1.3620 caps price, with $1.2840 below.

Spark Morpho Vault Timelocks: Zero-Delay Allocator Changes From Oct 26
The Spark Morpho vault timelocks plan cuts allocator and penalty delays to zero on two vaults and raises adapter delays to 3 and 7 days. Poll runs Oct 19 to 22.