XRP Price Analysis: A Sweep To $1.2840 Fades Back Toward The Low
XRP price analysis: two sweeps under $1.3112 on Oct 15 reversed, then XRP slid to $1.296. A four-hour gap at $1.3448 to $1.3620 caps price, with $1.2840 below.

In this article+
XRP has spent two days probing the same floor. The 12:00 UTC four-hour candle on October 15 dipped to $1.2840, under a swing low, and closed at $1.3391. Today's candles gave most of that bounce back, and XRP was near $1.2960 at 18:44 UTC. This XRP price analysis uses closed Binance candles through 16:00 UTC on October 16.
What happened to XRP price on October 15
Two four-hour candles on October 15 took out the $1.3112 swing low from October 13 and closed back above it. The 04:00 UTC candle reached $1.2913, and the 12:00 UTC candle went to $1.2840, on 37.5 million XRP. Both are sweeps, where price runs under a level to trigger stops and then reverses.
The reversal faded. Today's 12:00 UTC candle opened at $1.3465 and closed at $1.3089, down 2.8%, on 20.3 million XRP. The median four-hour volume over the last 300 candles is 19.3 million.
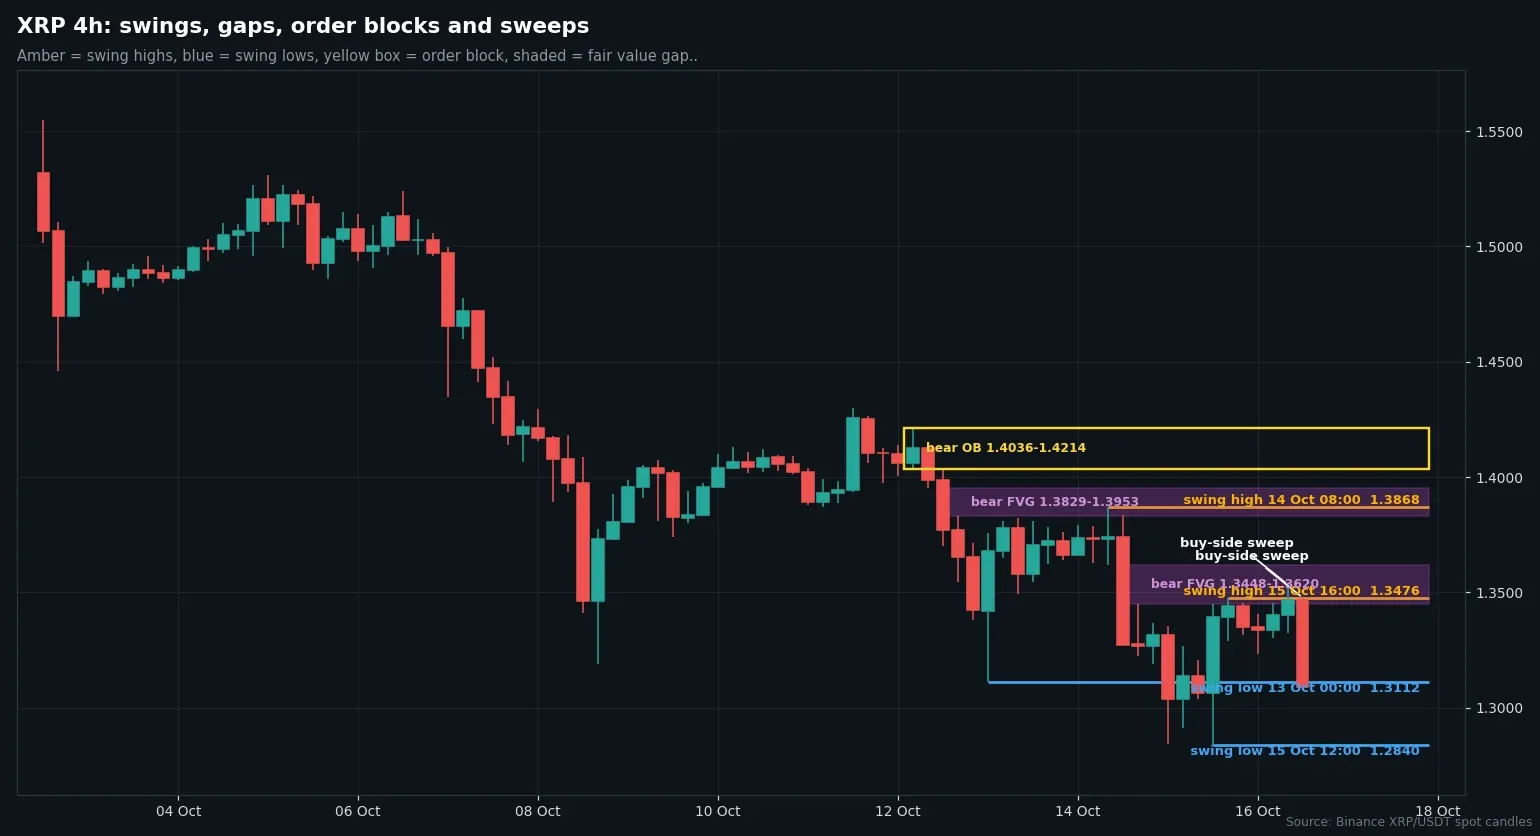
Four-hour XRP/USDT candles from Binance, with swing points, order blocks and fair value gaps. Chart by Martin.
The daily picture for XRP price
The daily trend turned down on October 7, when XRP closed under the $1.4458 swing low from October 2. Since then, daily closes have mostly drifted lower, from $1.4215 on October 7 to $1.3316 on October 14. The October 15 daily candle closed at $1.3349 with a low of $1.2840, the lowest daily low in ten days.
Price now sits under all three daily averages. The 20-day is at $1.4134, the 50-day at $1.3910 and the 200-day at $1.3786. On the weekly chart the trend is also down, and the last weekly swing low is $1.2468 from September 14.
Gaps and blocks above, support below
The nearest overhead level is a bearish four-hour gap from $1.3448 to $1.3620, left by the October 14 slide. Above it, a bearish order block spans $1.4036 to $1.4214. A bearish order block is the last up candle before a sharp drop.
A larger bearish gap on the daily chart runs from $1.4295 to $1.4907 and dates to October 8. Underneath, price is sitting inside a bullish daily order block from September 17, which spans $1.2877 to $1.3201. The $1.2840 low from October 15 is the floor just beneath it.
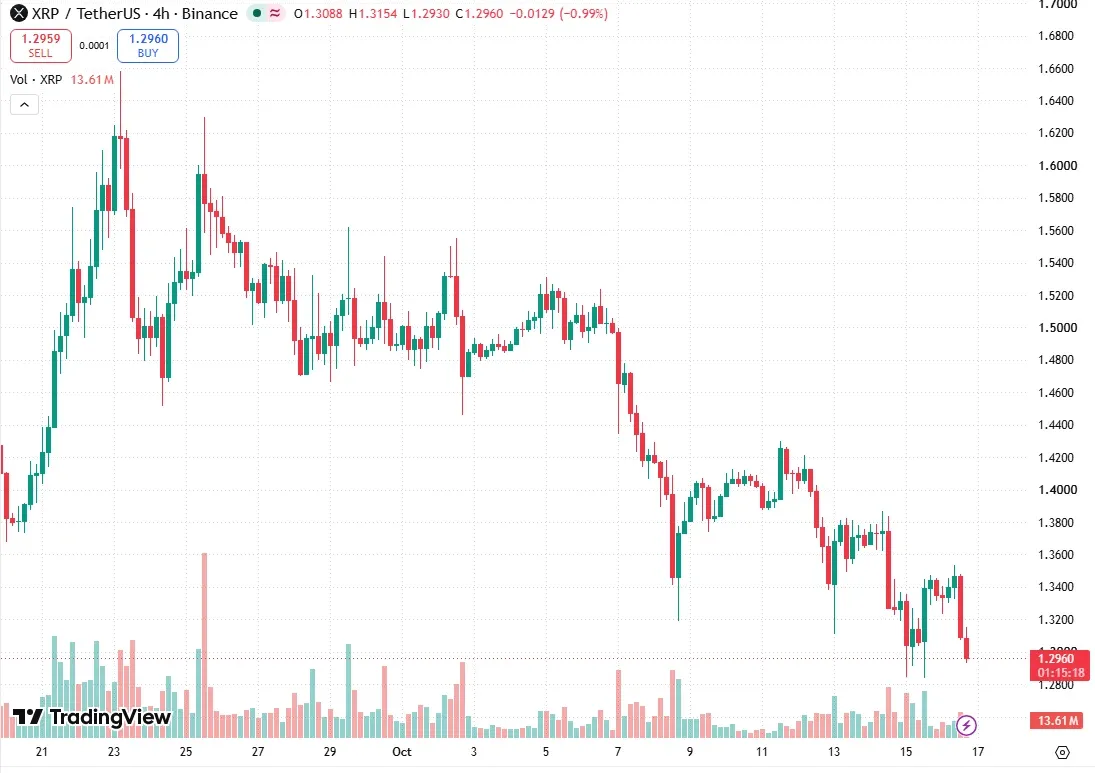
XRP/USDT four-hour chart on TradingView, captured at 18:44 UTC on October 16. Chart by Martin.
Two scenarios for XRP
The constructive case needs a four-hour close above $1.3620, the top of the nearest gap. After that, $1.3872 is the next swing high to watch. A daily close back over the 50-day average near $1.3910 would be the first repair of the daily structure.
The cautious case starts with a four-hour close under $1.2840. That would end the sweep idea and put the September 14 weekly low at $1.2468 in view. Both ideas lose weight if price closes back inside the $1.2840 to $1.3620 range.
TradingView shows XRP down about 6% over the past week at the time of capture. We have no lean. This XRP price analysis covers candles that already closed and is not advice to buy or sell.
Written by
Writer and editor at Times of Crypto Era. Covers Bitcoin, DeFi, and market structure.
View full profile →Related News

FIL Price Analysis: A Sweep To $0.9999 Reverses To $1.2013
FIL price analysis: a sweep to $0.9999 on Oct 15 reversed to a $1.2013 high, and FIL sits near $1.13. A bullish gap at $1.0804 to $1.1317 is below price.

Aave V4 Tempo Proposal: One Hub, Two Spokes And OUSD Borrowing
The Aave V4 Tempo proposal asks for one liquidity hub, two spokes and OUSD, cbBTC and PRIME. A July Temp Check drew 392,686 in voting power for, none against.

Spark Morpho Vault Timelocks: Zero-Delay Allocator Changes From Oct 26
The Spark Morpho vault timelocks plan cuts allocator and penalty delays to zero on two vaults and raises adapter delays to 3 and 7 days. Poll runs Oct 19 to 22.