SAND Volume Spike: One Candle Trades 114M Tokens In A 20% Rebound
SAND volume spike: the 12:00 UTC four-hour candle traded 114M tokens, nearly nine times the median, as price rebounded 20% from $0.0528. Levels and scenarios.

In this article+
The Sandbox token woke up on Saturday. SAND had spent a week sliding after a huge early-October run, and then a run of strong four-hour candles pushed it back above $0.06. The SAND volume spike peaked in the 12:00 UTC candle, which traded about 114 million tokens against a typical 13 million.
The 16:00 UTC close on October 17 came in at $0.0631 on Binance. From the $0.0528 low of October 15 that is a rebound of about 20%. From the $0.0881 high on October 7 it is still a long way down.
The 12:00 candle ran up to $0.0669 and then gave a chunk back, which leaves a long upper wick on the chart.
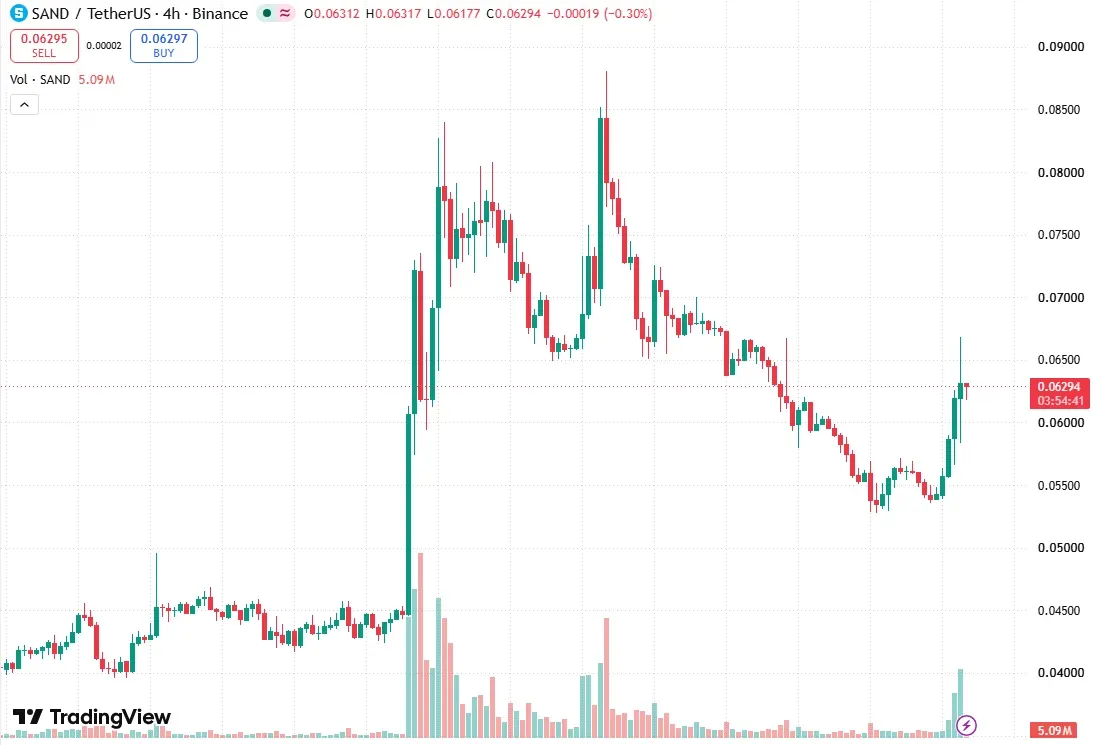
SAND/USDT four-hour chart on TradingView, captured at 16:03 UTC on October 17. Chart by Brian Otieno.
Volume came before price
Look at the volume bars on the chart and the order is clear. The 04:00 candle traded 29 million tokens and closed at $0.0587. The 08:00 candle traded 74 million and closed at $0.0620. The 12:00 one then hit 114 million.
Each was bigger than the one before. For scale, the usual candle over the last 120 holds about 13 million. The first of the three was roughly twice that, the last nearly nine times. A bounce with that much behind it is harder to dismiss than a thin drift upward. That is why the SAND volume spike is worth a chart.
The SAND volume spike meets a supply zone
The 12:00 high of $0.0669 poked just above the October 12 swing high at $0.0668, then closed back at $0.0631. That is called a buy-side sweep. Price took the liquidity sitting above an old high and returned below it right away.
It also ran into supply. A bearish four-hour gap from October 11 spans $0.0655 to $0.0669, and a bearish order block from the same day sits at $0.0647 to $0.0662. Another block from October 10 reaches up to $0.0681.
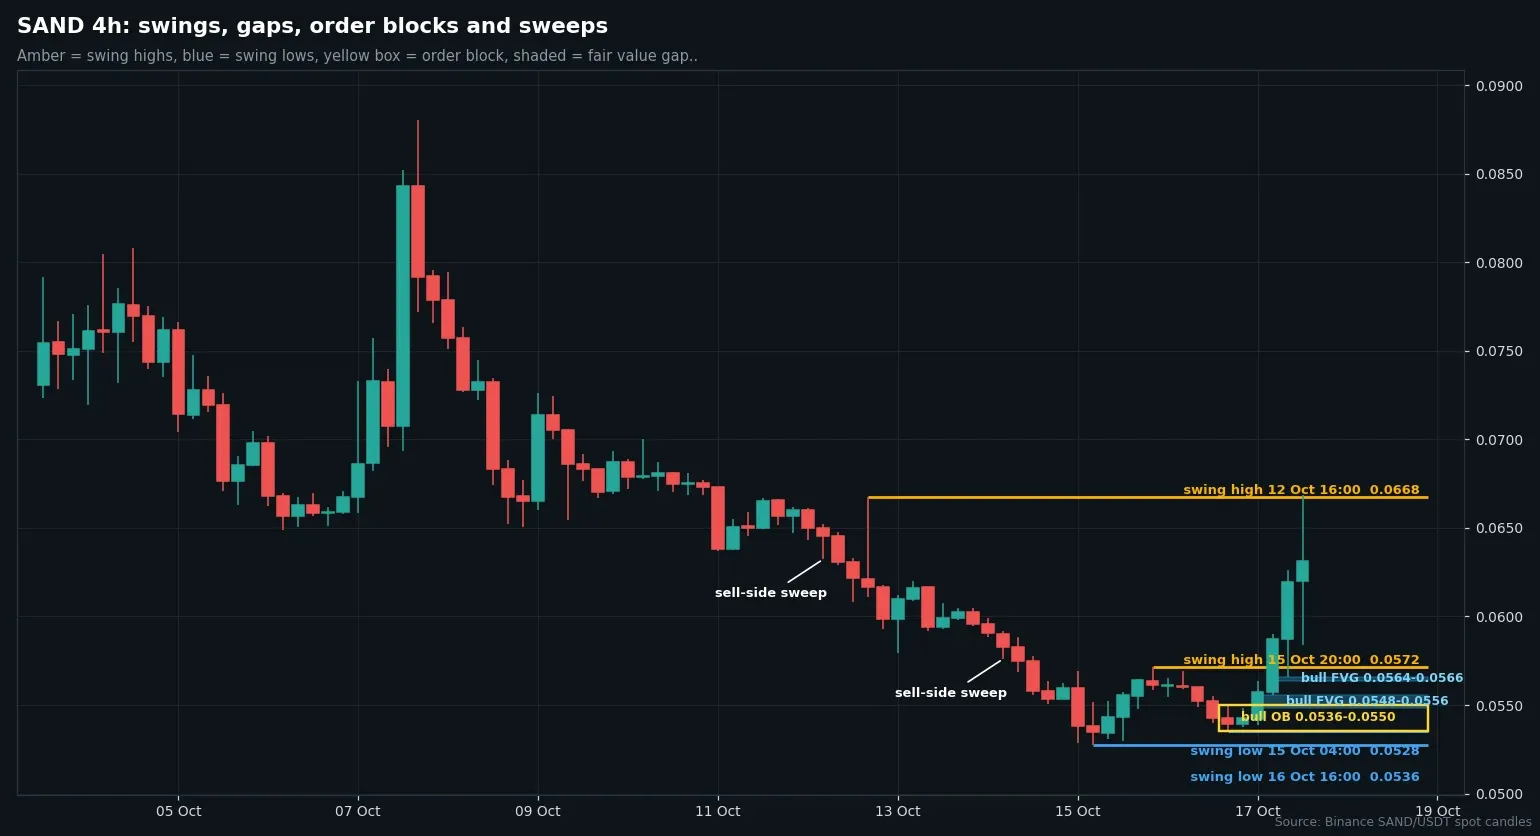
Four-hour SAND/USDT candles from Binance with swing points, order blocks and fair value gaps. Chart by Brian Otieno.
The bigger picture after the SAND volume spike
On the daily chart SAND remains in an up structure that began in late August. The big run peaked on October 3 at $0.0840. On October 7 price swept above that high to $0.0881 and reversed. Since then the token has given back about 40% of that peak, measured to the $0.0528 low.
Price now sits above the 20-day average near $0.0585 and the 50-day near $0.0521. The 200-day average at $0.0643 is just overhead, and that is the first test of the rebound. On the weekly chart the last swing low is $0.0325 from mid-September.
Two ways SAND can go from here
For bulls, a four-hour close above $0.0669 would clear the sweep high and the stacked supply under it. $0.0700 would be next.
The cautious case needs a four-hour close under $0.0556, which gives back most of Saturday's candles. After that the bullish block at $0.0536 to $0.0550 and the $0.0528 low come into play.
We lean neither way. All figures come from closed candles, and nothing here is a recommendation to buy or sell SAND.
Loading…
Written by
Brian Otieno reports on Bitcoin and Ethereum markets, spot ETF flows and derivatives data for Times of Crypto Era. Every figure in the pieces is checked against the live source before publishing.
View full profile →Related News

EPIC 54% Drop Meets A 31% Rebound On 90x Candle Volume
EPIC 54% drop: from $0.4593 to $0.2113 in two days, then a 31% four-hour rebound on 90x volume. Key levels, fair value gaps and two 4h-close scenarios.

Marqeta Coinbase Stablecoin Cards: Base Handles The Settlement
Marqeta Coinbase stablecoin cards: Coinbase handles custody and conversion, Base settles, and Marqeta issues and processes. Announced Oct 16, no launch date.

FIL Price Analysis: A Sweep To $0.9999 Reverses To $1.2013
FIL price analysis: a sweep to $0.9999 on Oct 15 reversed to a $1.2013 high, and FIL sits near $1.13. A bullish gap at $1.0804 to $1.1317 is below price.