INJ Buy-Side Sweep At $9.417 Fades Into An $8.095 Flush
An INJ buy-side sweep to $9.417 faded into an $8.095 low on October 22. Read closed Binance candle levels, the daily trend and two 4h-close scenarios.

In this article+
INJ poked above its mid-October high on October 21, printed $9.417 and gave the move back within hours. By the 04:00 UTC close on October 22 INJ was at $8.159. The candle behind that close started at $8.622 and dipped as low as $8.095. This note reads that INJ buy-side sweep from closed Binance candles only.
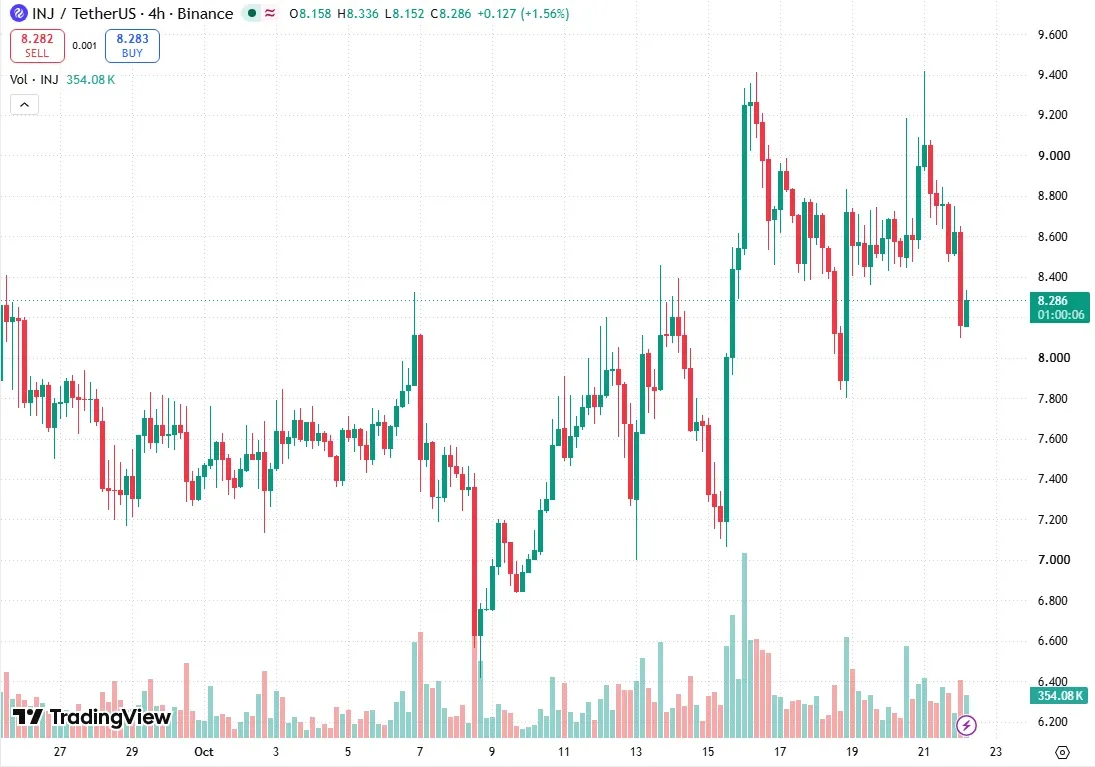
INJ against Tether on the four-hour chart, read at 07:00 UTC on October 22. Source: TradingView, INJUSDT on Binance.
How the INJ buy-side sweep unfolded
Earlier, the high stood at $9.413 from the October 16 daily candle. Five days later, the 00:00 UTC four-hour candle on October 21 stretched to $9.417, four tenths of a cent higher. It closed at $9.050 and every close after that was lower: $8.812, $8.753, $8.760, $8.519 and $8.620.
October 20 had a smaller version of the same thing. A candle at 12:00 UTC reached $9.184 on about 779,000 tokens of volume, then finished at $8.605. Two spikes into the $9s, two fades. The daily closes were $8.948 and then $8.620.
Damage came from the latest closed candle. From 00:00 to 04:00 UTC on October 22 it fell from $8.622 to a low of $8.095 and closed at $8.159. That close sits under $8.358, the October 19 swing low, so the four-hour structure turned down. That candle traded about 489,000 INJ, well above the 200,000 to 300,000 of the quiet candles before it.
What the daily chart still says
Zoom out and the picture is steadier, because one INJ buy-side sweep does not break a daily trend. The daily trend reads up. On October 15 a daily close above $8.326 flipped the structure higher. Averages back that up. Roughly $8.08 marks the 20-day exponential, $7.27 the 50-day and $5.90 the 200-day.
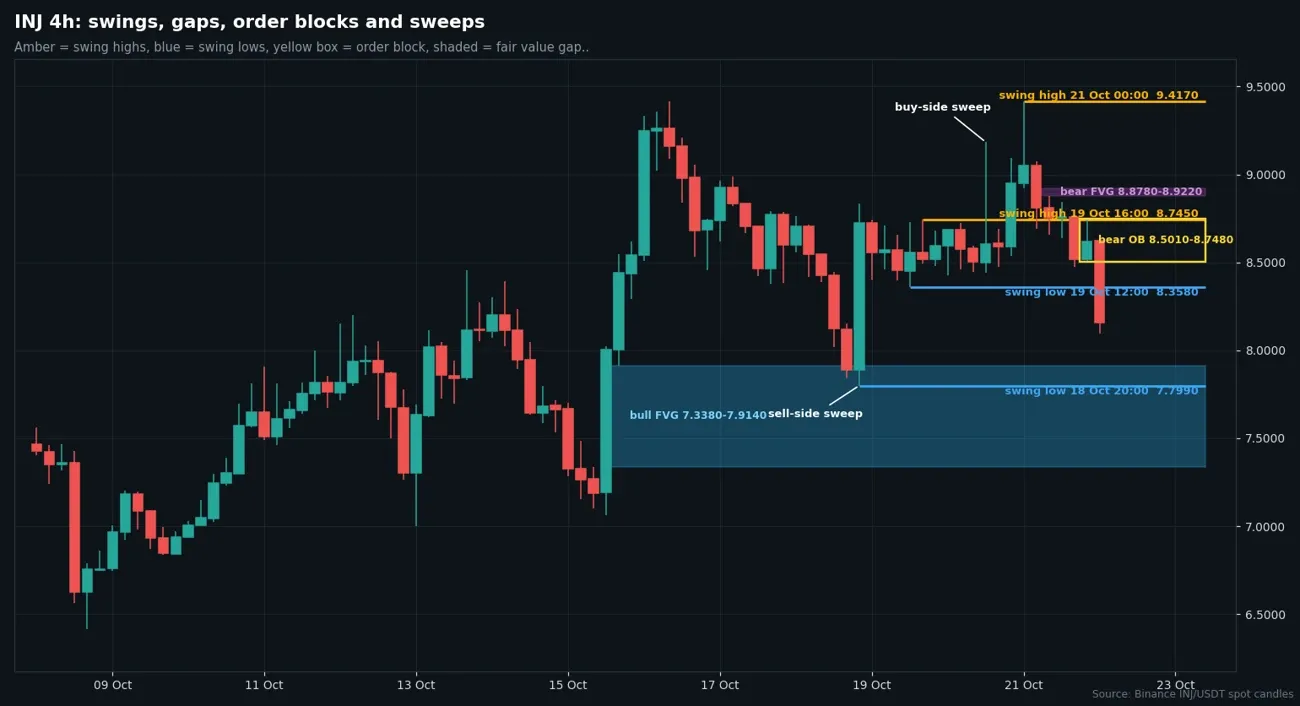
Four-hour candles from Binance spot with swing points, gaps and an order block drawn in. Chart by Daniel Kiprop.
Overhead, the four-hour chart holds a bearish order block between $8.501 and $8.748, and a bearish gap from $8.878 to $8.922. Underneath, a bullish daily order block runs from $7.534 to $8.394. Price at $8.28 is inside that block.
Bitcoin sits above its 100-day average, about $82,457 against $74,972. INJ is inside its 20-day range, roughly 12% under the 20-day high. Binance's account ratio showed 61% of accounts long at 07:00 UTC, and the last three funding prints hovered near zero.
Two INJ paths from the 4h closes
Upside needs a four-hour close above $8.748, the top of the bearish block. That opens $8.922, then the $9.417 high. A four-hour close under $8.095 cancels it.
Downside starts with a four-hour close below $8.095, the low of the last candle. Next stops are the October 18 low at $7.799 and the lower edge of the daily block near $7.534. A four-hour close back above $8.501 cancels that one.
We have no lean here. A fade after a sweep can be a pause inside an uptrend or the start of a deeper pullback. This INJ buy-side sweep could still go either way. Every level above is read off closed Binance candles. Treat them as reference points and nothing more.
Loading…
Written by
Daniel Kiprop covers exchanges, listings, stablecoins and institutional crypto moves for Times of Crypto Era. Stories start from company filings and official announcements, not secondary coverage.
View full profile →Related News

XRP Ledger Amendment fixCleanup3_4_0 Cannot Go Live Before Nov 4
One XRP Ledger amendment, fixCleanup3_4_0, cannot activate before Nov 4, XRPSCAN shows. See the vote counts, the 80% rule and what the fix bundle changes.

Ondo Stocks On Solana Reach 1inch, But Issuer Rankings Differ
Ondo stocks on Solana reached 1inch on October 20. RWA.xyz data on October 21 ranks Ondo second among tokenized-stock issuers, not first as the post says.

ENA Price Analysis: A Bounce Runs Into A Stack Of Overhead Levels
ENA price analysis from closed candles at 08:00 UTC on October 21: price sits inside a bearish gap near $0.204 with a 4h break up and two paths to watch.