PYTH Price Analysis: A $0.1009 Spike Gives Back Most Of Its Gains
PYTH price analysis: a spike to $0.10094 on 93.7M PYTH faded to $0.0839 in a day. A bullish block at $0.08474 to $0.08892 holds, with a bearish gap near $0.093.

In this article+
Pyth spent less than a day above $0.09 before sellers took it back. On October 15, the 12:00 UTC four-hour candle ran from $0.08641 to a high of $0.10094 and closed at $0.09739. By 18:34 UTC on October 16, PYTH sat near $0.0839, about 10% lower on the day. This PYTH price analysis uses closed Binance candles through 16:00 UTC.
The volume behind the PYTH price analysis
That 12:00 UTC candle traded 93.7 million PYTH. The median four-hour volume over the last 300 candles is 8.26 million, so the spike ran at about eleven times normal. The daily candle for October 15 added up to 254.6 million PYTH, the most of any day in the last eight.
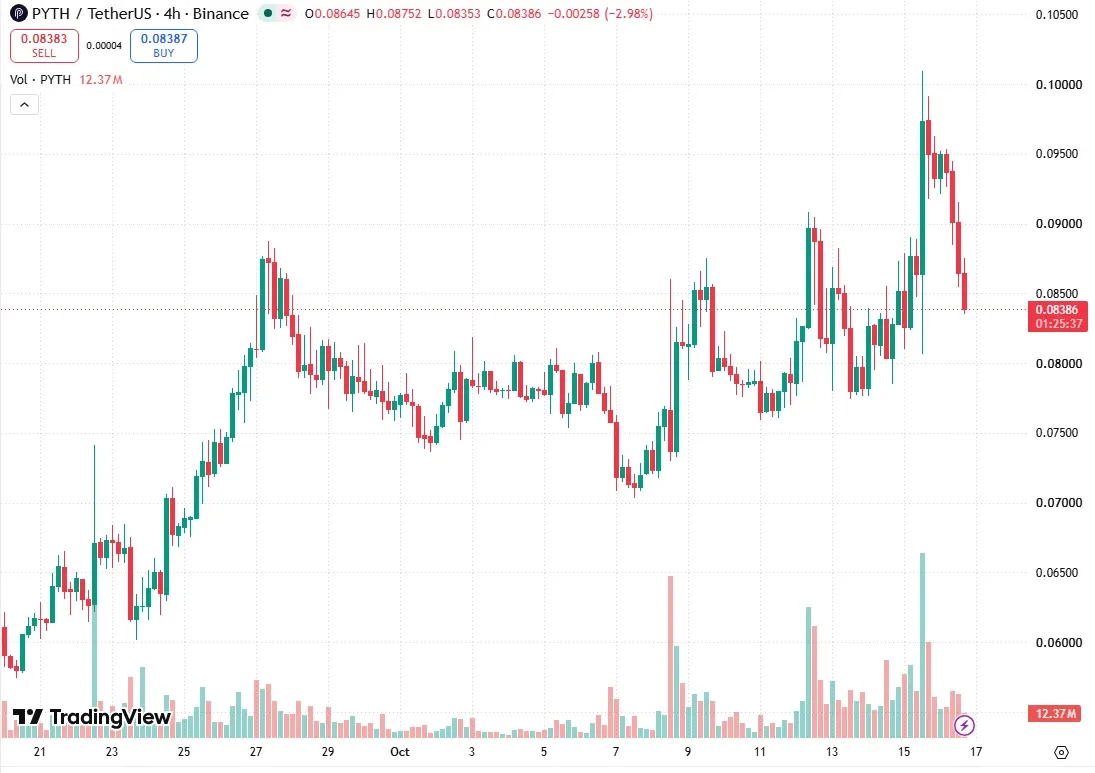
PYTH/USDT four-hour chart on TradingView, captured at 18:34 UTC on October 16. Chart by Martin.
The fade came in steps. The 16:00 UTC candle on October 15 closed at $0.09502, and the next ones kept slipping. The 12:00 UTC candle on October 16 closed at $0.08644, down 4.1% from its open at $0.09012.
Daily structure after the spike
On the daily chart, price is above its 20-day average at $0.07816, the 50-day at $0.06824 and the 200-day at $0.05717. All three are rising. The September 27 swing high at $0.08874 was taken out on October 12, when the daily wick reached $0.09082.
PYTH rose a long way before this week. Its September 11 daily low was $0.04997, and it has since climbed well above that. The weekly chart shows the last weekly swing high at $0.07370 from January 5, which price has cleared.
Blocks and gaps from the last week
A bullish four-hour order block, the last down candle before a strong rise, spans $0.08474 to $0.08892. It comes from the October 15 08:00 candle, and price is trading inside its lower half. A larger bullish daily block runs from $0.07745 to $0.08827.
Four-hour swing lows have stepped up since October 11, from $0.07590 to $0.07745, then $0.07850 and $0.08063. That ladder is the structure the cautious case would break.
Above price there is one open bearish gap, which is a space left by a quick fall. It spans $0.09155 to $0.09265 and formed in the October 16 12:00 candle. The October 15 high of $0.10094 sits above it as the top of the move.
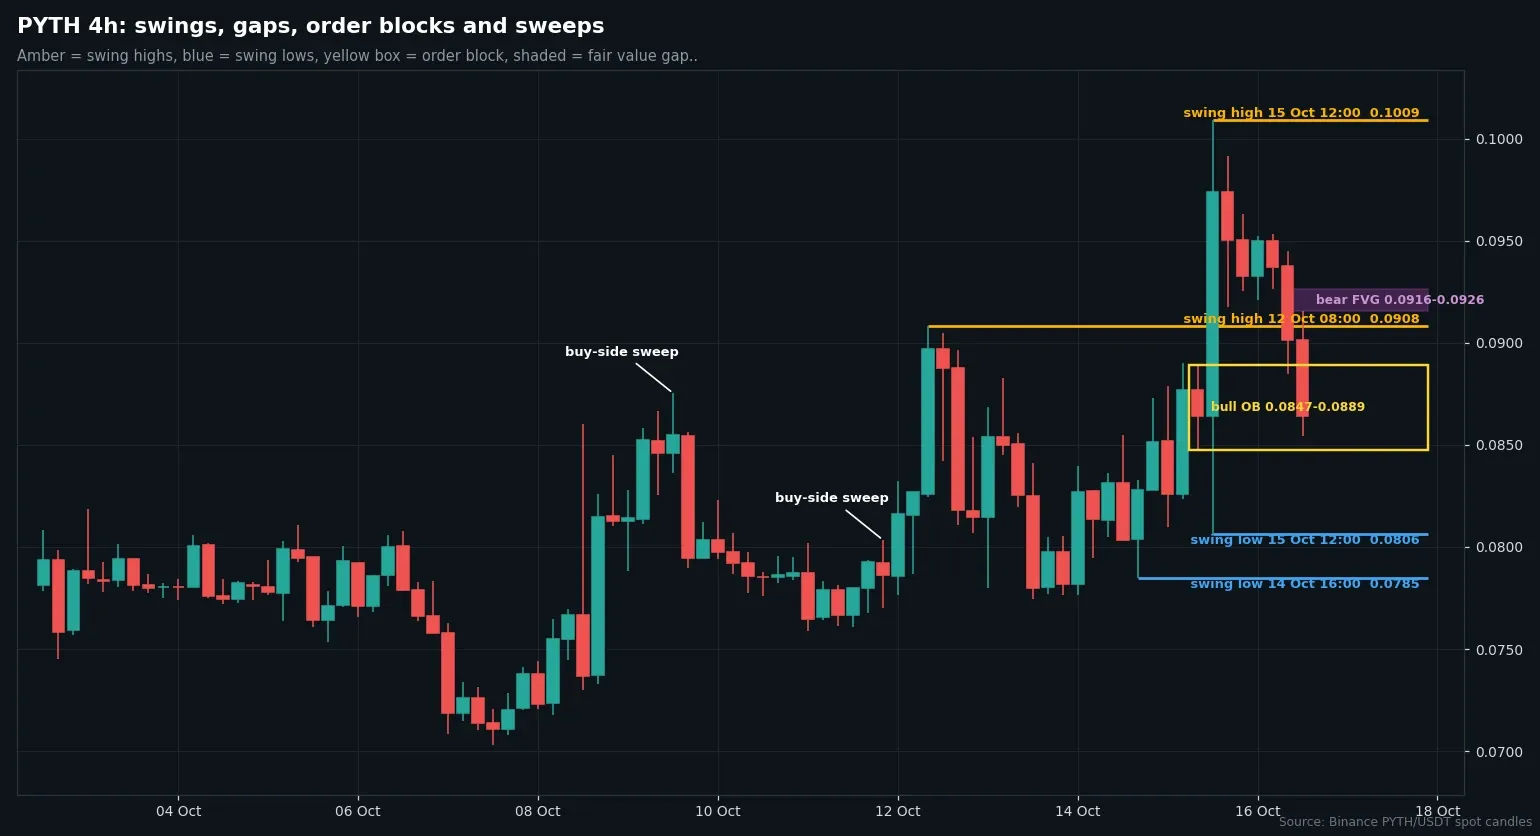
Four-hour PYTH/USDT candles from Binance, with swing points, order blocks and fair value gaps. Chart by Martin.
Two scenarios for PYTH
The constructive case needs a four-hour close above $0.09265, the top of the bearish gap. After that, the October 15 close of $0.09739 and the high at $0.10094 are the next markers. Holding above the block base near $0.08474 keeps the recent higher lows in play.
The cautious case starts with a four-hour close under $0.08063, the swing low from the October 15 spike candle. That would put the October 14 low at $0.07850 and the $0.07745 base of the daily block in reach. Both ideas lose weight if price closes on the other side of the $0.08474 to $0.09265 band.
We have no lean. This PYTH price analysis covers candles that already closed and is not advice to buy or sell.
Loading…
Written by
Writer and editor at Times of Crypto Era. Covers Bitcoin, DeFi, and market structure.
View full profile →Related News

Spark Morpho Vault Timelocks: Zero-Delay Allocator Changes From Oct 26
The Spark Morpho vault timelocks plan cuts allocator and penalty delays to zero on two vaults and raises adapter delays to 3 and 7 days. Poll runs Oct 19 to 22.

Unichain Operator Migration Sends L1 Fee Share To OP Enterprise
The Unichain operator migration to OP Enterprise targets Oct 29. Optimism governance has a vote on a proposer key, an L1 fee leg and a 0.15 ETH minimum.

USDC Revenue Split: $819M To Partners And Costs In H1, Circle Says
The USDC revenue split Circle gave for H1: $819M to partners and costs. The 10-Q shows $819.3M on $1,395.4M of revenue and net income of $103.5M, about 7 cents.