STRK Price Analysis: A 37% Drop From $0.1265 Tests The $0.082 Low
STRK price analysis: Starknet's token fell about 37% from its October 11 spike to 0.1265, testing a four-hour low. Gaps, order block and two scenarios inside.

In this article+
Starknet's STRK token has handed back more than a third of its spike. It reached $0.1265 on Binance on October 11, roughly two and a half times its October 7 close, on $113 million of volume. By the 04:00 UTC four-hour candle on October 14 it had slid to $0.0802. This STRK price analysis marks where the spike left its footprints and which levels still matter.
STRK price analysis: climb, sweep and fall
The climb took four days, and volume grew with it. Trading was under $9 million on October 7 and rose every day after that, topping out near $113 million on October 11. That day closed at $0.1232, after a late push to $0.1265 that cleared the earlier peak of $0.1239.
The turn came on October 12. The first candle of the day poked to $0.1249, above the same earlier high, and then price rolled over. The session lost about 31% and closed at $0.0851. October 13 went nowhere, finishing at $0.0852, while the highs of the day stayed below $0.0934.
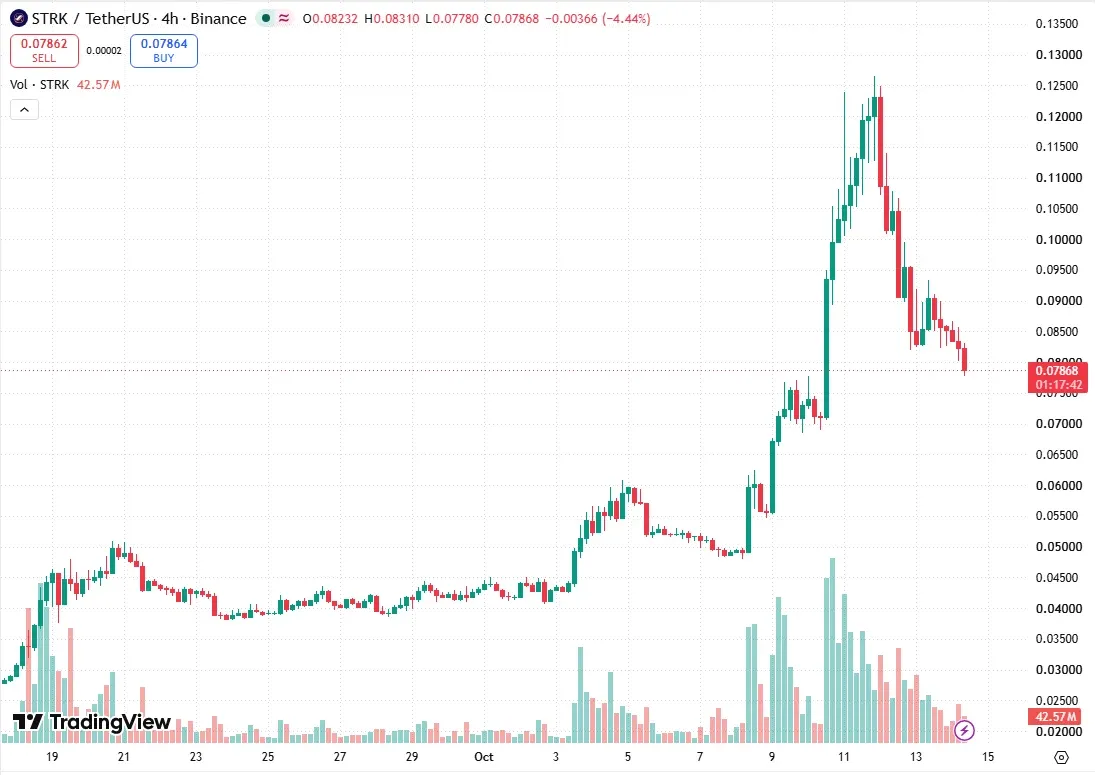
STRK/USDT four-hour chart on TradingView. Chart by Brian Otieno.
Gaps and blocks around the fall
Fast drops leave footprints. On the four-hour chart the fall opened a bearish fair value gap, an area where candles barely overlap. Price has not been back to it since sellers took over there. The gap is narrow, running from $0.0995 to $0.1007, and the daily chart carries a similar zone just below.
Under price the picture is different. The October 10 push opened a large bullish gap, and STRK is trading inside it today. It stretches from $0.0718 to $0.0892. Beneath it sits the last real base before the run, a bullish order block formed on October 8 that spans $0.0547 to $0.0570. Any STRK price analysis has to treat that block as the floor if the gap fails.
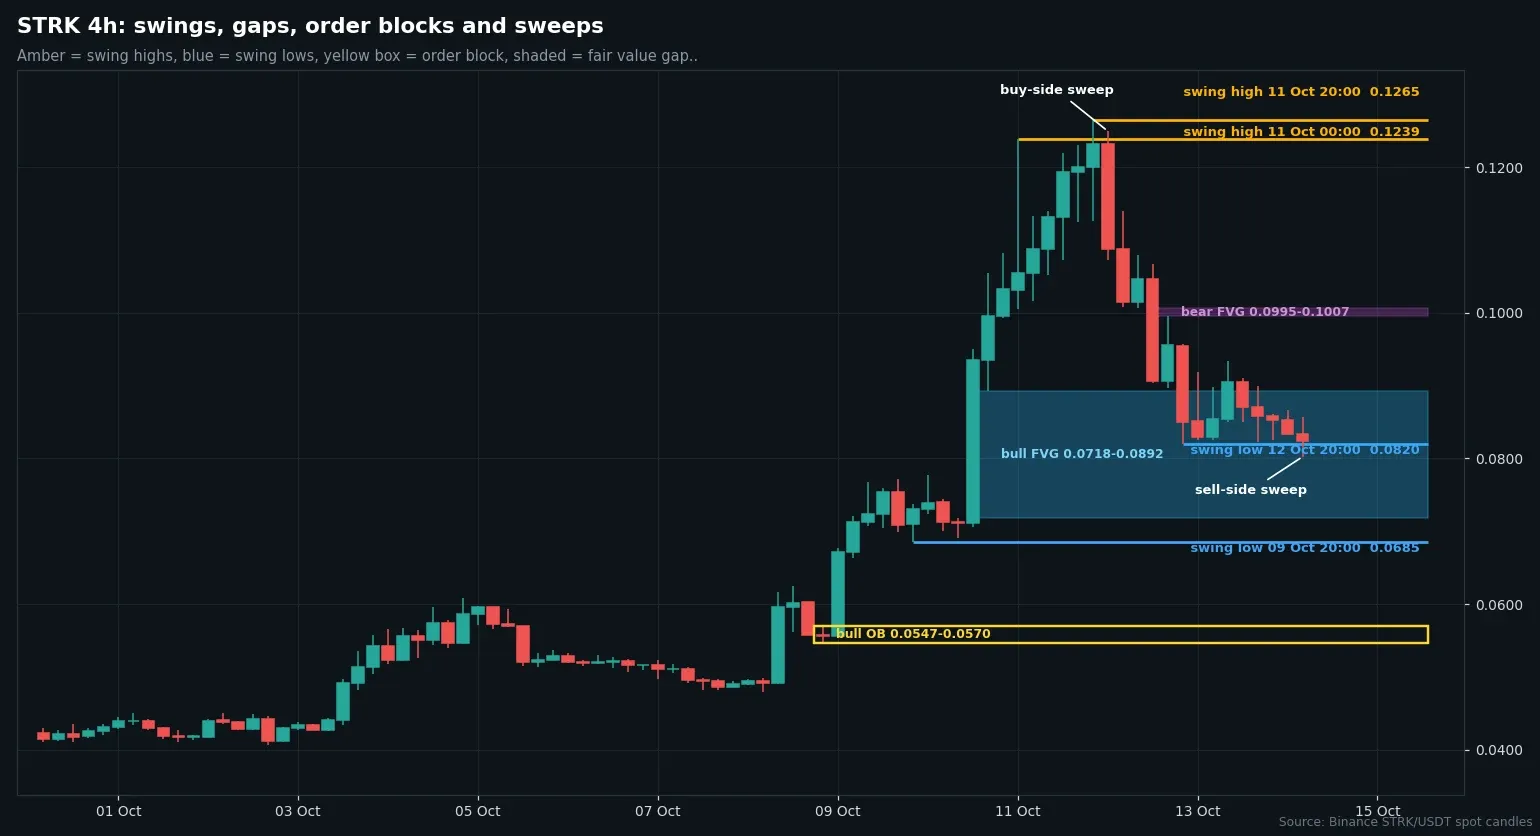
Four-hour STRK/USDT candles from Binance data. Chart by Brian Otieno.
The last closed candles in the STRK price analysis
The 04:00 UTC candle on October 14 dipped to $0.0802, under the $0.0820 swing low from October 12, and closed back above it at $0.0823. Traders call that a sell-side sweep, a grab of orders resting under an obvious low. The next candle was still open when this was written, and it had already traded lower, near $0.0778.
That matters for how to read the chart. A sweep that closes back inside the range is a bounce signal only until the next candle confirms it. Until a four-hour candle closes below the sweep low, the $0.0820 area remains a level that buyers have defended once.
On the daily chart STRK still trades above all three major averages. The shortest sits around six and a half cents, and the 200-day is near four and a half. The weekly chart printed a bullish break of structure on October 5. The larger picture therefore still leans up even after the drop.
Two scenarios from four-hour closes
The bullish case needs a four-hour close above $0.0934, the October 13 high. That would reopen the road to the bearish gap near $0.0995. The bearish case starts with a close under $0.0802, the sweep low, which would put the bottom of the large gap at $0.0718 in play. The order block at $0.0570 sits beneath that. Every level here comes from closed Binance candles through 08:00 UTC on October 14, and none of it is trade advice.
Written by
Brian Otieno reports on Bitcoin and Ethereum markets, spot ETF flows and derivatives data for Times of Crypto Era. Every figure in the pieces is checked against the live source before publishing.
View full profile →Related News

Ether ETF Outflow Streak Ends After 10 Days With $24.8M Inflow
The ether ETF outflow streak ended after 10 days with a 24.8 million dollar inflow on October 13, Farside data shows. Bitcoin funds added 175.7 million dollars.

Ethereum Coinbase Premium Hits -0.117, Yet USDC Pair Shows -0.02%
The Ethereum Coinbase Premium Index fell to -0.1173, but against Binance's USDC pair the gap is only -0.02%. How the quote currency changes the reading.

OP Price Analysis: 21% Daily Gain Stalls Near $0.1625
OP price analysis: the token gained 21% on October 13, hit 0.1625 on October 14, then pulled back into a four-hour gap. Key levels and two scenarios inside.