UNI CME Futures Debut Nears With The $7.00 Floor Swept Twice
UNI CME futures are scheduled for Oct 19 after a 35% slide from $10.94. The $7.00 floor was swept twice, volume is thin, and two 4h-close scenarios are mapped.

In this article+
Uniswap's UNI heads into a big institutional date after a hard month. CME Group says UNI futures are scheduled to start on Monday, October 19, pending regulatory review. The UNI CME futures debut follows a 35% slide from the $10.94 high of September 23. At 16:00 UTC on October 17 the token traded at $7.108 on Binance.
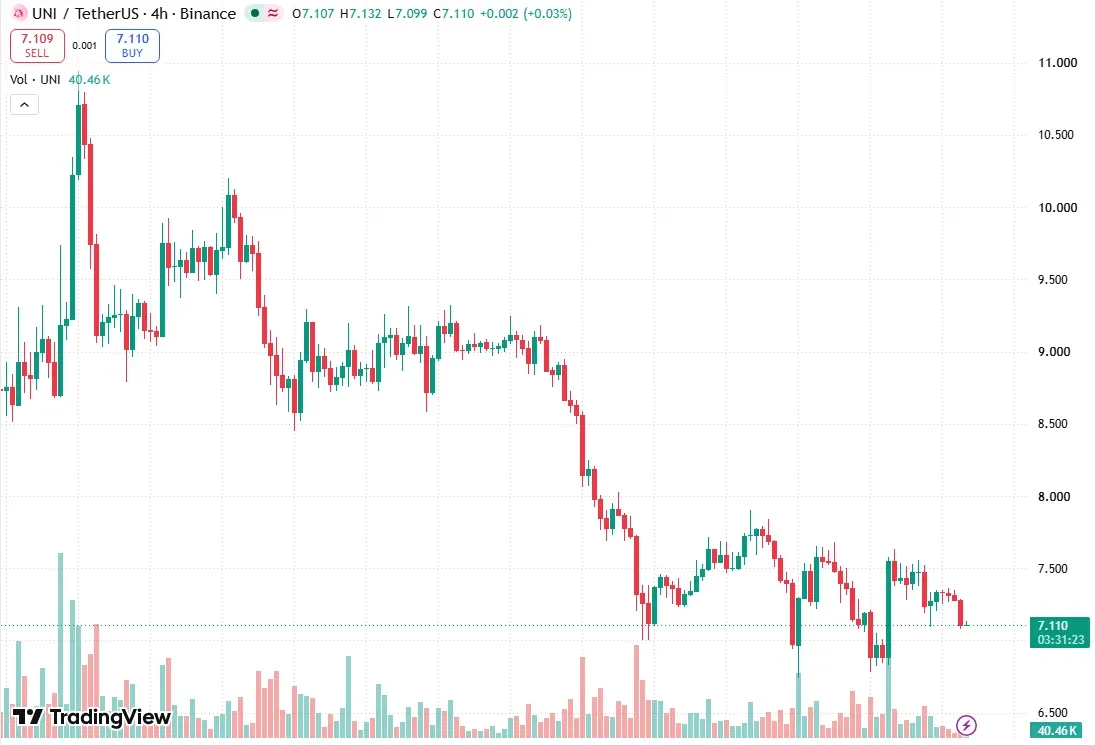
UNI/USDT four-hour chart on TradingView, captured at 16:07 UTC on October 17. Chart by Brian Otieno.
CME's September 22 press release pairs the UNI launch with Bitcoin Cash futures. It lists two contract sizes, 10,000 UNI and a micro contract of 1,000 UNI. Price action since then has not been kind, so the UNI CME futures story starts with the chart.
The daily trend turned down on October 7, when UNI closed under the $8.447 swing low from September 29. Since October 9 it has traded between $6.74 and $7.90.
A $7.00 floor swept twice
The level that matters is $7.00, the October 8 swing low. On October 13 the price dropped to $6.742, well under it, and the day still closed at $7.541. Two days later it did the same thing. The October 15 low was $6.784 and the close was $7.431.
Both times sellers took out the lows and buyers pushed price right back. That is a sell-side sweep. On Saturday's 12:00 UTC candle UNI also dipped to $7.076, under the $7.092 low from Friday, and closed above it at $7.108.
Volume was thin through that stretch. The last three four-hour candles traded about 338,000, 181,000 and 658,000 tokens, while the median four-hour candle over the last 120 holds roughly 944,000. That is quiet trade ahead of the UNI CME futures launch, and nothing more can be read into it.
Averages and gaps around the UNI CME futures date
UNI is under its 20-day average at $7.85 and its 50-day at $7.32. It remains above the 200-day at $5.38. On the weekly chart the structure is still up, and the last weekly swing low is $3.17 from August 10.
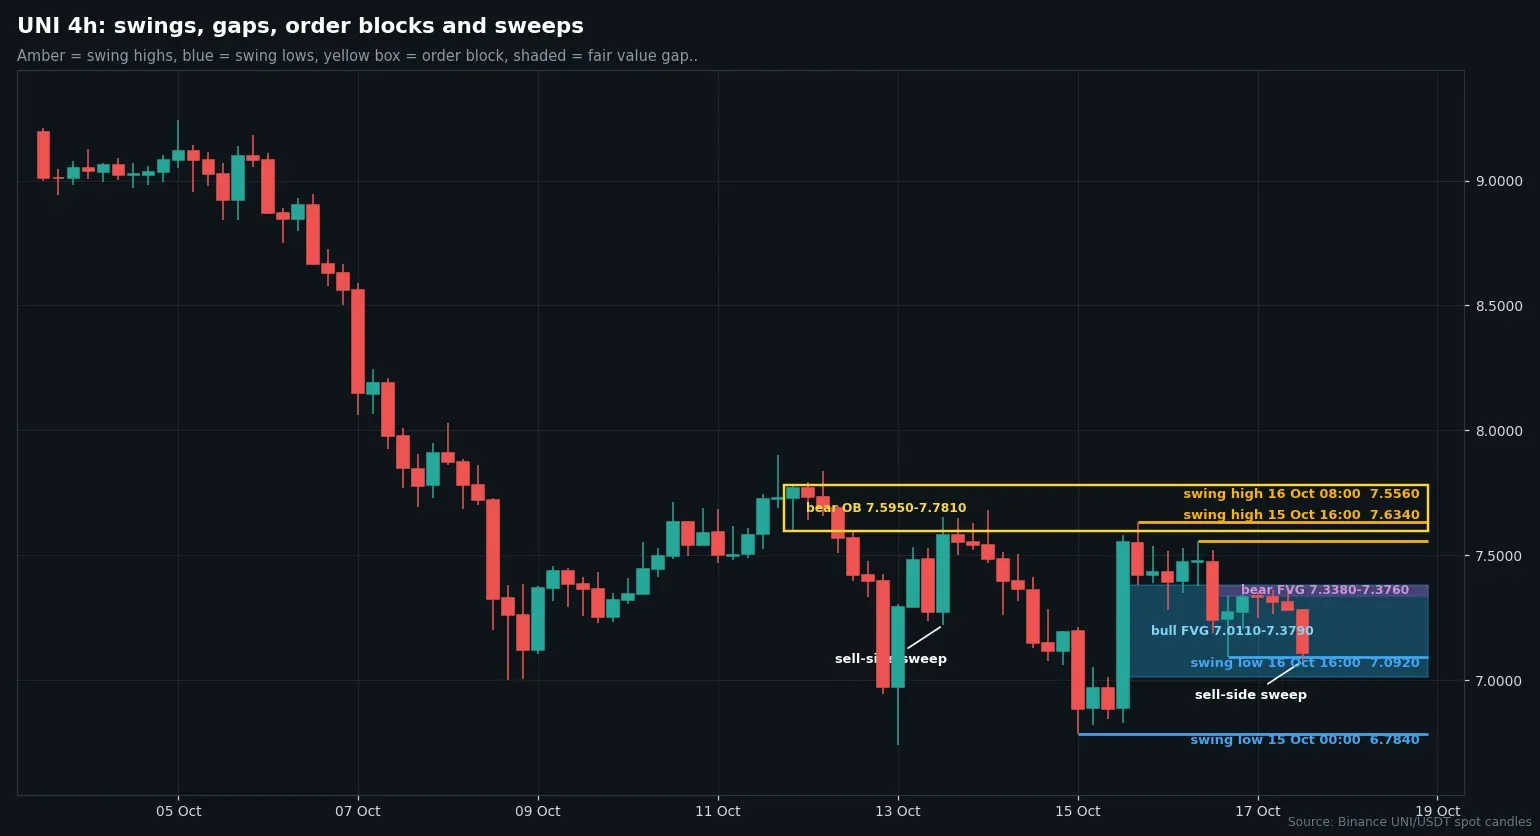
Four-hour UNI/USDT candles from Binance with swing points, order blocks and fair value gaps. Chart by Brian Otieno.
A bullish four-hour gap from October 15 spans $7.011 to $7.379, and price is sitting in it. A bearish gap from October 16 covers $7.338 to $7.376. Higher up, a bearish order block from October 11 runs from $7.595 to $7.781.
Two ways the chart can resolve
The constructive case needs a four-hour close above $7.556, the October 16 swing high. Then the $7.595 to $7.781 block is the next area, followed by the $7.901 swing high.
The cautious case starts with a four-hour close under $7.011, the bottom of the bullish gap. After that the $6.742 low and the daily bullish block between $6.168 and $6.839 come into play. It loses weight if price closes above $7.556 first.
We lean neither way. These are closed-candle facts, and nothing here is advice to buy or sell UNI. CME's date remains subject to the review mentioned in its release.
Loading…
Written by
Brian Otieno reports on Bitcoin and Ethereum markets, spot ETF flows and derivatives data for Times of Crypto Era. Every figure in the pieces is checked against the live source before publishing.
View full profile →Related News

Mysten Labs CEO Change: Kevin Boon Takes Over, Cheng Leads AI Unit
The Mysten Labs CEO change puts Kevin Boon in charge while Evan Cheng stays CTO and leads a new AI business unit, per an October 16 letter on the Mysten blog.

ZRO Support At $1.88 Faces A Fourth Test After A 10% Slide
ZRO support near $1.88 is being tested for a fourth time after a 10% daily slide from $2.483. Order blocks, bearish gaps and two 4h-close scenarios inside.

SAND Volume Spike: One Candle Trades 114M Tokens In A 20% Rebound
SAND volume spike: the 12:00 UTC four-hour candle traded 114M tokens, nearly nine times the median, as price rebounded 20% from $0.0528. Levels and scenarios.