ZRO Support At $1.88 Faces A Fourth Test After A 10% Slide
ZRO support near $1.88 is being tested for a fourth time after a 10% daily slide from $2.483. Order blocks, bearish gaps and two 4h-close scenarios inside.

In this article+
LayerZero's ZRO has slid about 10% in 24 hours and landed on a floor it already knows. The ZRO support near $1.88 held on October 9, October 14 and October 15. At the 16:00 UTC close on October 17 it was being tested a fourth time, with price at $1.887 on Binance.
A week of lower highs
The top came on October 12. ZRO ran to $2.483 that day, swept above the $2.299 high from October 6 and closed at $2.071. That is a classic fake-out, where price takes a high and cannot stay there. The day also had the heaviest volume of the last eight, 13.8 million tokens, and every day since has traded less.
Since then each rally has been weaker than the one before. The October 16 swing high was $2.282, set in the 04:00 UTC candle. From there the four-hour closes stepped down to $2.102, then $2.047, then $1.980, and finally $1.887 at the latest close.
What happened at the ZRO support level
The floor is not a single price. On the daily chart the October 9 low is $1.886. On October 14 price dipped to $1.883 and closed at $1.892. A day later it went much lower, to $1.800, and then rallied hard to close at $2.086.
That October 15 candle is the key one. It swept the lows and bounced about 16% from low to close. The four-hour candle that started the rebound left a bullish order block between $1.81 and $1.94, and price is sitting inside it now.
The 12:00 UTC candle today traded as low as $1.876, just beneath the old $1.886 low, and still closed at $1.887. So far sellers have poked through the ZRO support line but have not been able to close below it.
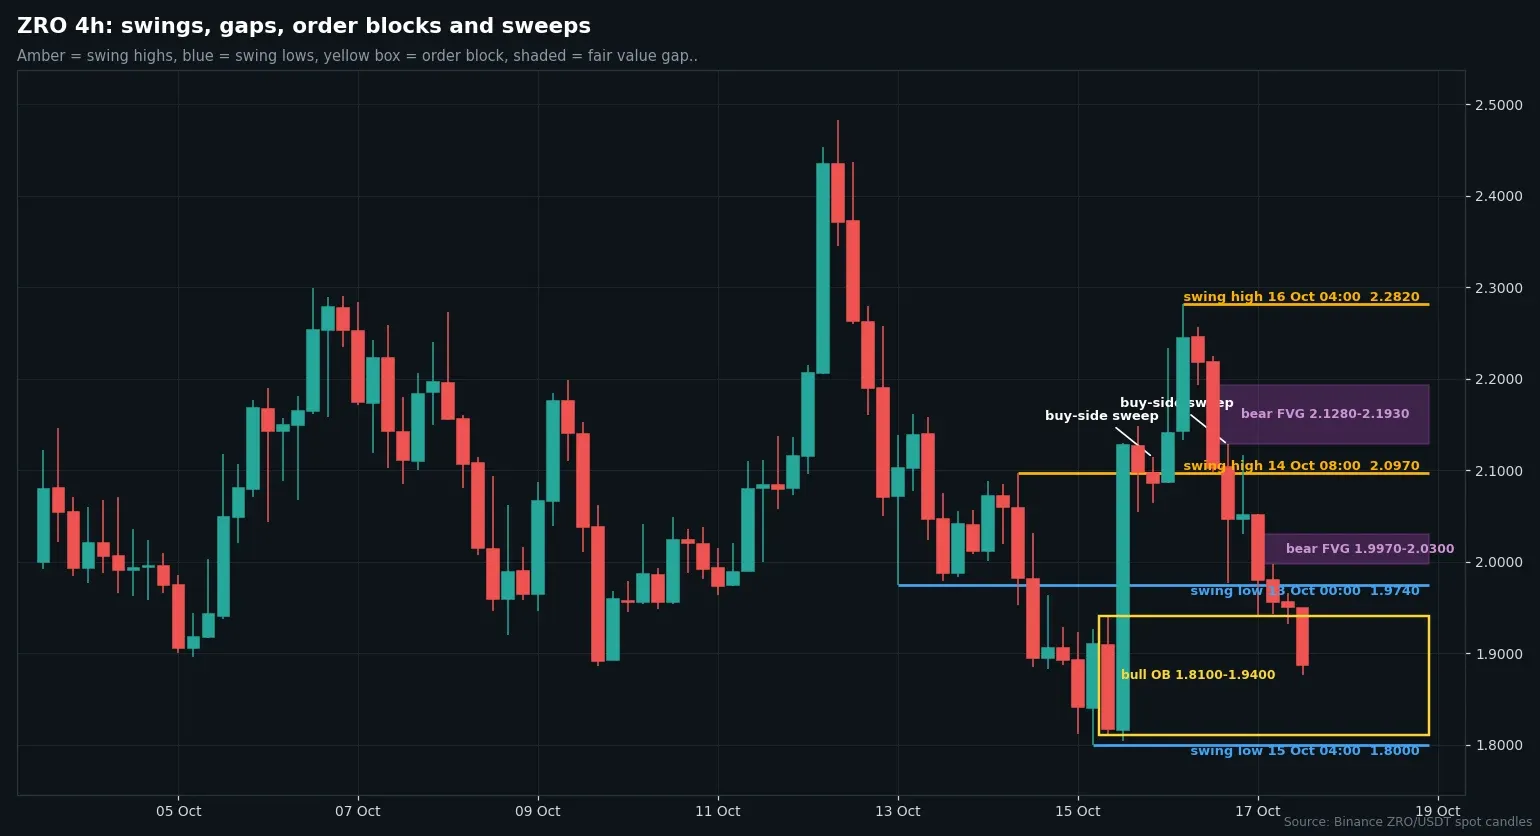
Four-hour ZRO/USDT candles from Binance with swing points, order blocks and fair value gaps. Chart by Daniel Kiprop.
Averages and structure
The bigger trend is still up. ZRO was near $0.92 in mid-September, and the weekly structure turned up on September 21. The 20-day average sits at $1.898, almost exactly where price is now. The 50-day is at $1.582 and the 200-day at $1.340.
On the four-hour chart there are two bearish gaps overhead. One runs from $1.997 to $2.030 and the other from $2.128 to $2.193.
Scenarios from the ZRO support area
A four-hour close above $2.030, the top of the nearest gap, would be the first sign that buyers regained control. After that the $2.128 to $2.193 gap and the $2.282 swing high are the next stops.
A four-hour close under $1.800 would take out the lowest wick of the whole base and the order block with it. The 50-day average near $1.58 would then be the next reference. That case weakens if price closes above $2.030 first. Until one of these triggers, the ZRO support zone stays unresolved.
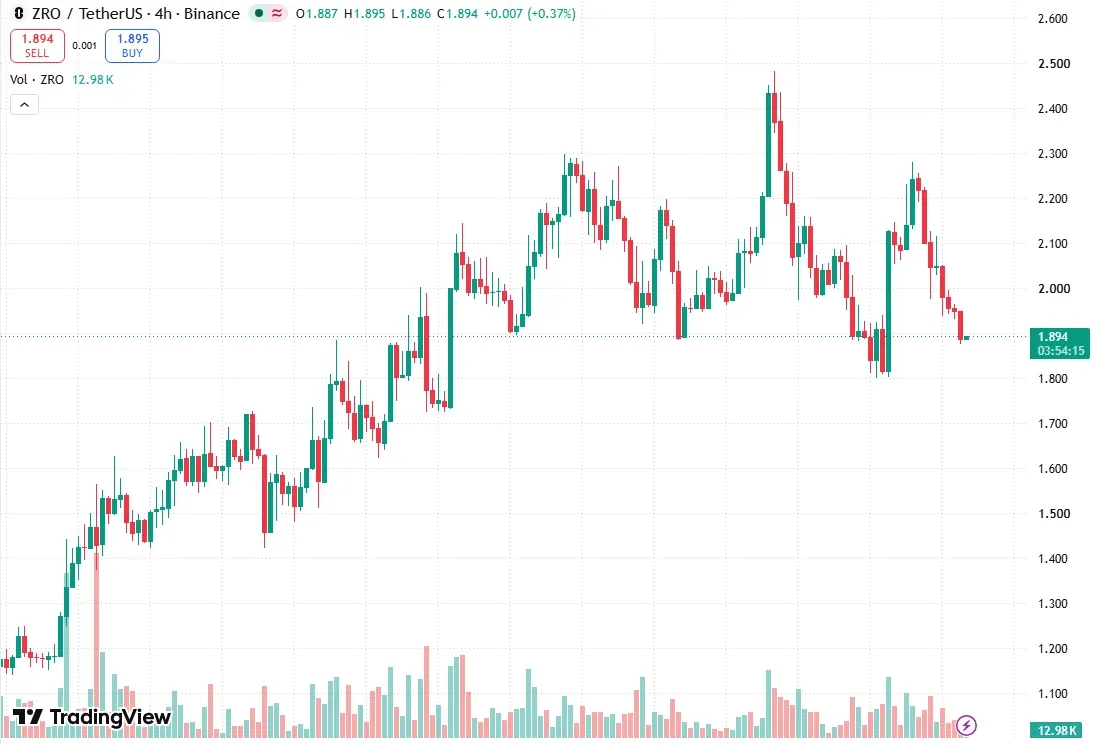
ZRO/USDT four-hour chart on TradingView, captured at 16:05 UTC on October 17. Chart by Daniel Kiprop.
Nothing about the ZRO support test points one way. We have no lean here. The numbers come from closed candles, and this is analysis only, not advice to buy or sell ZRO.
Loading…
Written by
Daniel Kiprop covers exchanges, listings, stablecoins and institutional crypto moves for Times of Crypto Era. Stories start from company filings and official announcements, not secondary coverage.
View full profile →Related News

Mysten Labs CEO Change: Kevin Boon Takes Over, Cheng Leads AI Unit
The Mysten Labs CEO change puts Kevin Boon in charge while Evan Cheng stays CTO and leads a new AI business unit, per an October 16 letter on the Mysten blog.

SAND Volume Spike: One Candle Trades 114M Tokens In A 20% Rebound
SAND volume spike: the 12:00 UTC four-hour candle traded 114M tokens, nearly nine times the median, as price rebounded 20% from $0.0528. Levels and scenarios.

EPIC 54% Drop Meets A 31% Rebound On 90x Candle Volume
EPIC 54% drop: from $0.4593 to $0.2113 in two days, then a 31% four-hour rebound on 90x volume. Key levels, fair value gaps and two 4h-close scenarios.