Bitcoin October Return Sits At -1.9% Against A +10.6% Median
Bitcoin October return is about -1.9% so far, against a +10.6% median for Octobers since 2018. Closed-candle levels and two four-hour scenarios inside.

In this article+
Bitcoin's reputation for strong Octobers is not showing up this year. The Bitcoin October return stands at about minus 1.9% so far. The monthly candle on Binance opened near $83,600 and was around $82,000 at 18:00 UTC on October 19. Across the eight completed Octobers since 2018 the median gain was 10.6%, by our calculation from the same candles.
Past Octobers for bitcoin
Most of them paid off. Six of the eight closed higher, led by 2021 with a gain near 40%. Two other years, 2020 and 2023, gained about 28% each. Only 2018 and 2025 ended lower, and both lost less than 4%. The 2025 month had even reached $126,200 early on before it faded.
The average gain of 14.4% leans on those big years, so the median is the fairer yardstick. With this year included, three of nine Octobers are negative. Twelve days remain, so the Bitcoin October return can still change.
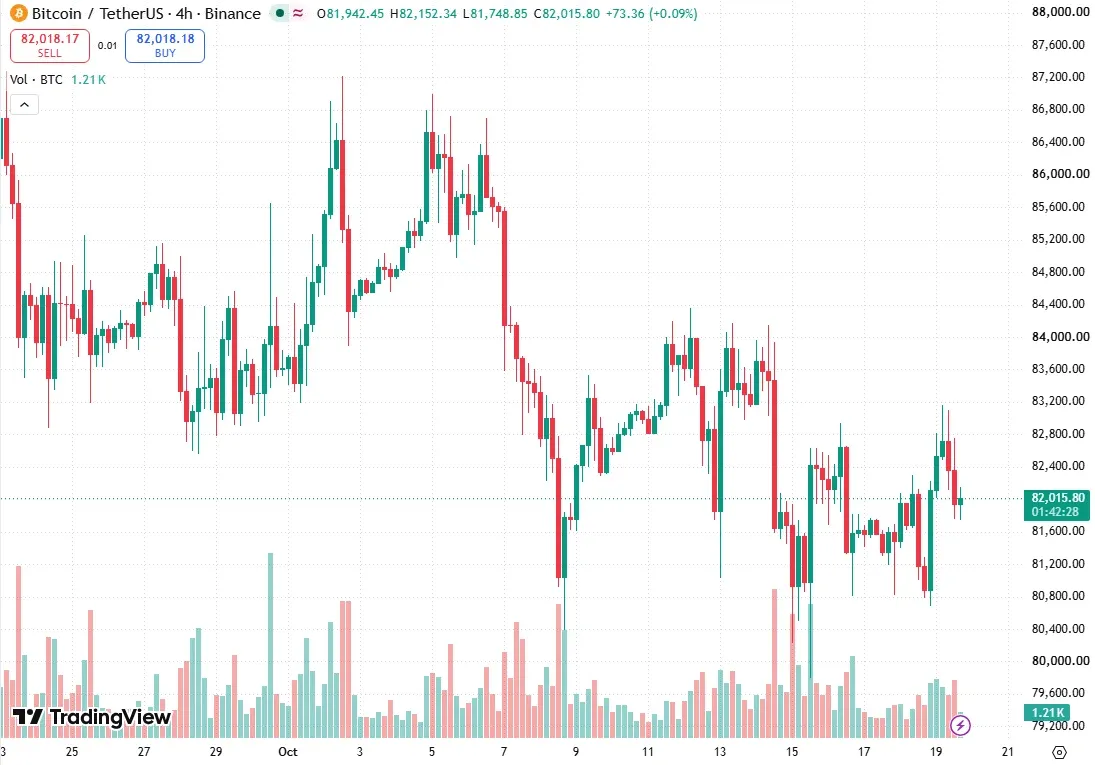
BTC/USDT four-hour chart on TradingView at 18:17 UTC on October 19. Source: TradingView.
The range holding bitcoin's October price
The month's high is $87,220 and its low $79,800, both from Binance candles. The low came on October 15 and the high on October 2. Price has sat inside that range since, and it is about 6% under the high.
On the daily chart the trend reads down. A break of structure below $82,563 happened on October 8, and the daily swing highs since then are lower, at $84,352 on October 12. The four-hour trend turned up on October 16, when price closed above $82,634. The weekly trend still reads up, so the timeframes disagree.
Levels from closed candles
Above price there is a bearish order block on the four-hour chart between $83,500 and $84,352, formed on October 12. A second block from October 14 spans $83,169 to $83,958. A daily gap sits higher, from $83,521 to $85,136.
Below price, a bullish four-hour gap from October 19 covers $81,283 to $82,011. Price sold off through $80,820 on October 18 and printed $80,684 before recovering. A buy-side sweep followed on October 19 at 12:00 UTC, reaching $82,757 over the $82,295 high.
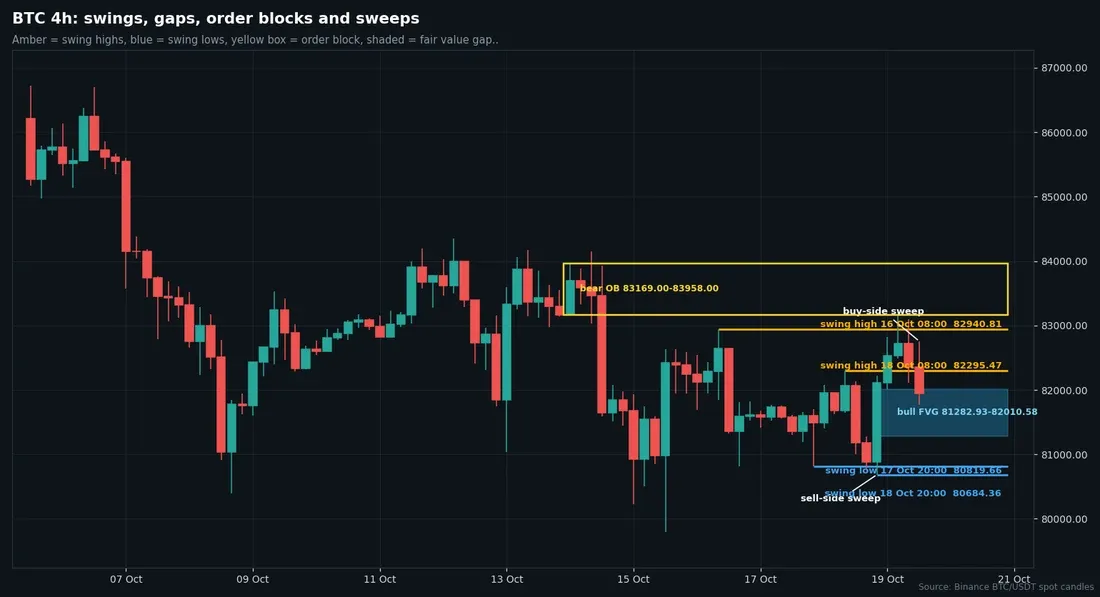
Four-hour BTC/USDT candles from Binance with swing points, order blocks, gaps and sweeps. Chart by Daniel Kiprop.
The daily 20-day average is near $82,638, the 50-day near $80,531 and the 200-day near $75,909, from closed candles. Price sits right on the 20-day, above the other two.
Two scenarios
The upside case needs a four-hour close above $84,352, the top of the October 12 block. It would also clear the October 14 block and open the way to the daily gap at $85,136.
The downside case starts with a four-hour close below $80,684. After that the $79,800 monthly low is exposed, and a daily close under it would extend the daily downtrend.
Both triggers wait for a four-hour candle to close, so a wick through a level on its own would not count, and the monthly picture would stay open until October 31.
We have no lean on bitcoin. These levels use closed candles, and nothing here is advice to buy or sell.
Written by
Daniel Kiprop covers exchanges, listings, stablecoins and institutional crypto moves for Times of Crypto Era. Stories start from company filings and official announcements, not secondary coverage.
View full profile →Related News

Strategy STRC Buyback: $193.1M Spent, Authority Lifted To $3.0B
Strategy STRC buyback: $193.1M repurchased 1.94M preferred shares in one week as the board raised its repurchase authority from $2.0B to $3.0B, per its 8-K.

Metaplanet Super League Deal: Holders Approve 2,100 BTC Swap
Metaplanet Super League deal cleared: holders approved 2,100 BTC plus $2.5M cash for 44.86M shares at $3.00, with a Superplanet rename at closing in Q4 2026.

Bitcoin ETF Outflows Narrow To $228.4M In A Week, From $678.9M Before
Bitcoin ETF outflows: spot funds lost $228.4M in the week to Oct 16, down from $678.9M a week earlier. IBIT drove most of it, per Farside Investors data.