HYPE Price Analysis: Lower Highs Press On A $76.15 Low
HYPE price analysis: lower highs from $95.25 and a $76.15 low keep the trend down. Four-hour levels, gaps and two closed-candle scenarios for the next move.

In this article+
Hyperliquid's token has spent two weeks making lower highs. This HYPE price analysis starts from the $95.25 peak on October 5 and follows each bounce since. At 08:18 UTC on October 20 HYPE traded near $78.63, with the week's low at $76.15.
How the HYPE decline built up
The slide came in steps. HYPE broke its daily structure on October 8 with a close under $84.64. It lost another leg on October 12, when it ran to $88.12 and then finished the day near $81. TradingView shows the token down about 14.5% over a month and about 3% over a week.
Each rebound since has stopped lower than the last. The four-hour highs run from $88.12 to roughly $82.80, then $82.64 and $80.43 on October 19. Lows follow the same staircase, with $78.48 on October 16, $77.16 on October 17 and $76.15 on October 18.
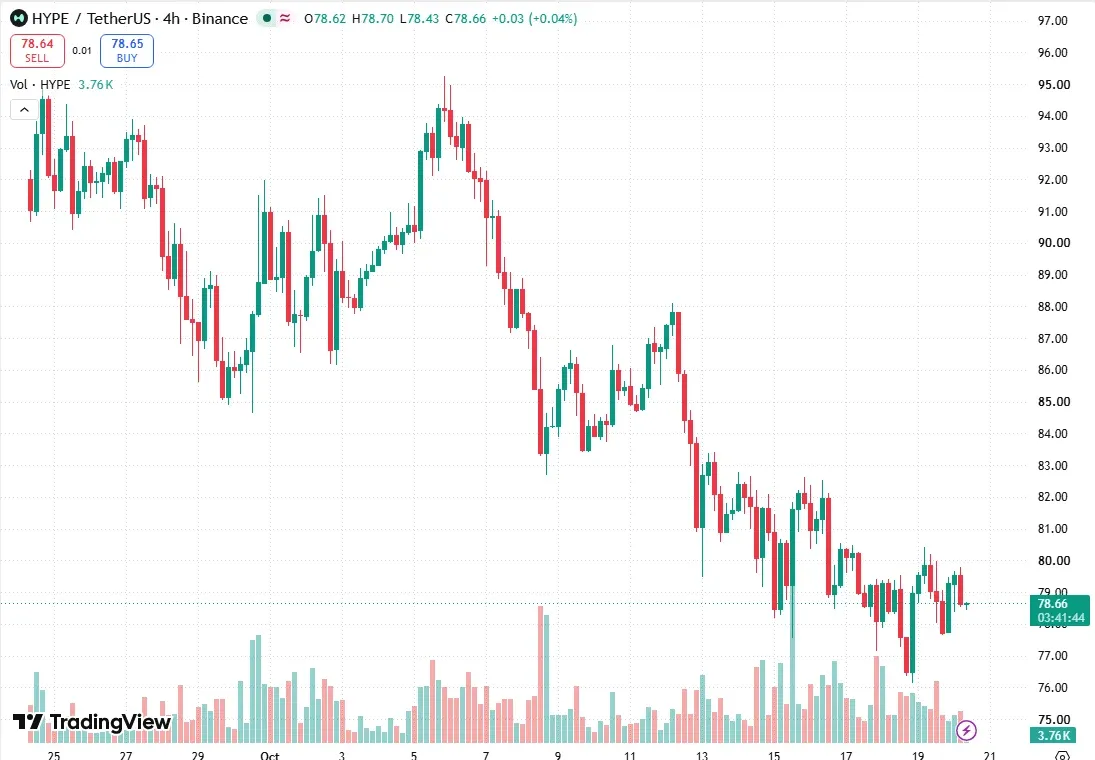
HYPE/USDT on the four-hour chart at 08:18 UTC on October 20. Source: TradingView.
What the HYPE price analysis shows on the four-hour chart
Sellers took out the $78.48 low several times on October 17 and 18, and each probe was bought back above it. The last one, at 20:00 UTC on October 18, ran down to $76.15 and closed back inside the range. A sweep like that can mark a pause. It does not turn the structure, because the highs are still falling.
Above price sits a bearish fair value gap from about $79.85 to $80.84, left by the October 16 drop. Higher up, a bearish order block spans $87.06 to $88.12, from the October 12 spike. Below, a small bullish gap covers $77.60 to $78.66, created on the October 19 open. HYPE trades inside that gap now.
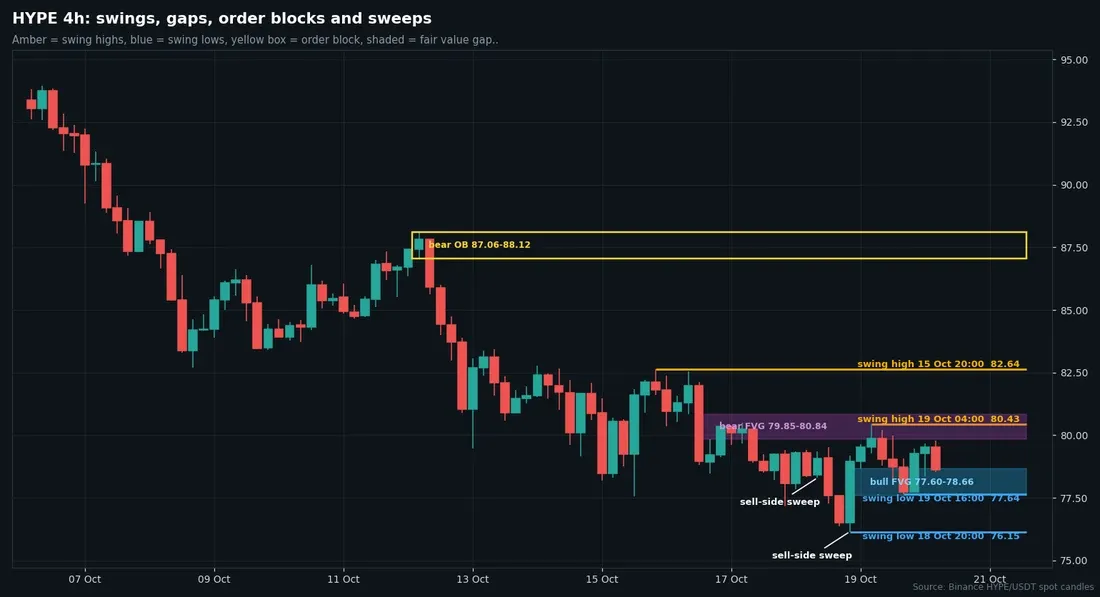
Four-hour candles from Binance with swing points, gaps and order blocks marked. Chart by Brian Otieno.
The daily picture is plain. HYPE has not closed a day above $82 since October 12, and the best close of the past week was $80.35 on October 16. The daily averages lean against the token as well. The 20-day sits near $84 and the 50-day near $87.60, both above price. The close of $79.28 on October 19 was the second highest of the last four days, which says more about a pause than a turn.
Where the HYPE price analysis points next
Price action over the next sessions decides which of two readings holds. Monday's range was narrow, from $77.64 to $80.43. The week before ran from $76.15 up to $88.12.
Two scenarios for HYPE
The upside case needs a four-hour close above $80.84, the top of the bearish gap. That would put the October 14 high near $82.80 in view, and the HYPE price analysis would only change character with a close above $88.12.
The downside case starts with a four-hour close under $77.60, which empties the small bullish gap. A close under $76.15, the October 18 low, would give a new low for the move.
Neither case is a forecast. We have no lean on HYPE, and the levels come from Binance candles that had already closed. Both cases wait on closed candles, so the one still open at 08:18 UTC does not count.
Loading…
Written by
Brian Otieno reports on Bitcoin and Ethereum markets, spot ETF flows and derivatives data for Times of Crypto Era. Every figure in the pieces is checked against the live source before publishing.
View full profile →Related News

Stellar Stablecoin Supply Hits $507M, With USDC 90% Of It
Stellar stablecoin supply reached $506.83M on DefiLlama, up 17% in a week, with USDC at 89.74% of the total after peaking near $521M on October 17 this week.

Babylon v4.6 Upgrade Brings Security Fixes, With Details Held Back
Babylon v4.6 upgrade proposal 26 cites important security fixes and sits at 100% yes. Details wait until after the upgrade at block 4,853,800 on October 22.

Celestia v10 Upgrade Went Live At Block 15,116,659, Adding Fibre
The Celestia v10 upgrade activated at block 15,116,659 on October 20, adding Fibre, a validator-served data availability protocol, plus node and RPC changes.