INJ Price Analysis: A 15% Slide Tests The $7.00 Swing Low
INJ price analysis: Injective fell 15% from $8.456 after two failed sweeps of $8.326. Four-hour support near $6.999, an order block and two scenarios.

In this article+
Injective could not hold the top. Twice in two days, INJ pushed above a daily swing high at $8.326, and twice it handed the gains back. By the 08:00 UTC candle on October 15 the token was at $7.19, about 15% under the $8.456 peak. This INJ price analysis maps where it stands now.
INJ price analysis: the failed highs in candles
The 16:00 UTC candle on October 13 hit $8.456, the highest print of the run, on 810,300 INJ of volume. That was about 3.4 times the median four-hour volume of 239,800. The candle closed at $8.114, well under its high.
A second attempt came on October 14. The 04:00 UTC candle reached $8.394 and closed at $8.113. After that the slide began. The 12:00 UTC candle lost 3.8% on 518,300 INJ, and the 00:00 UTC candle on October 15 lost another 4.4%.
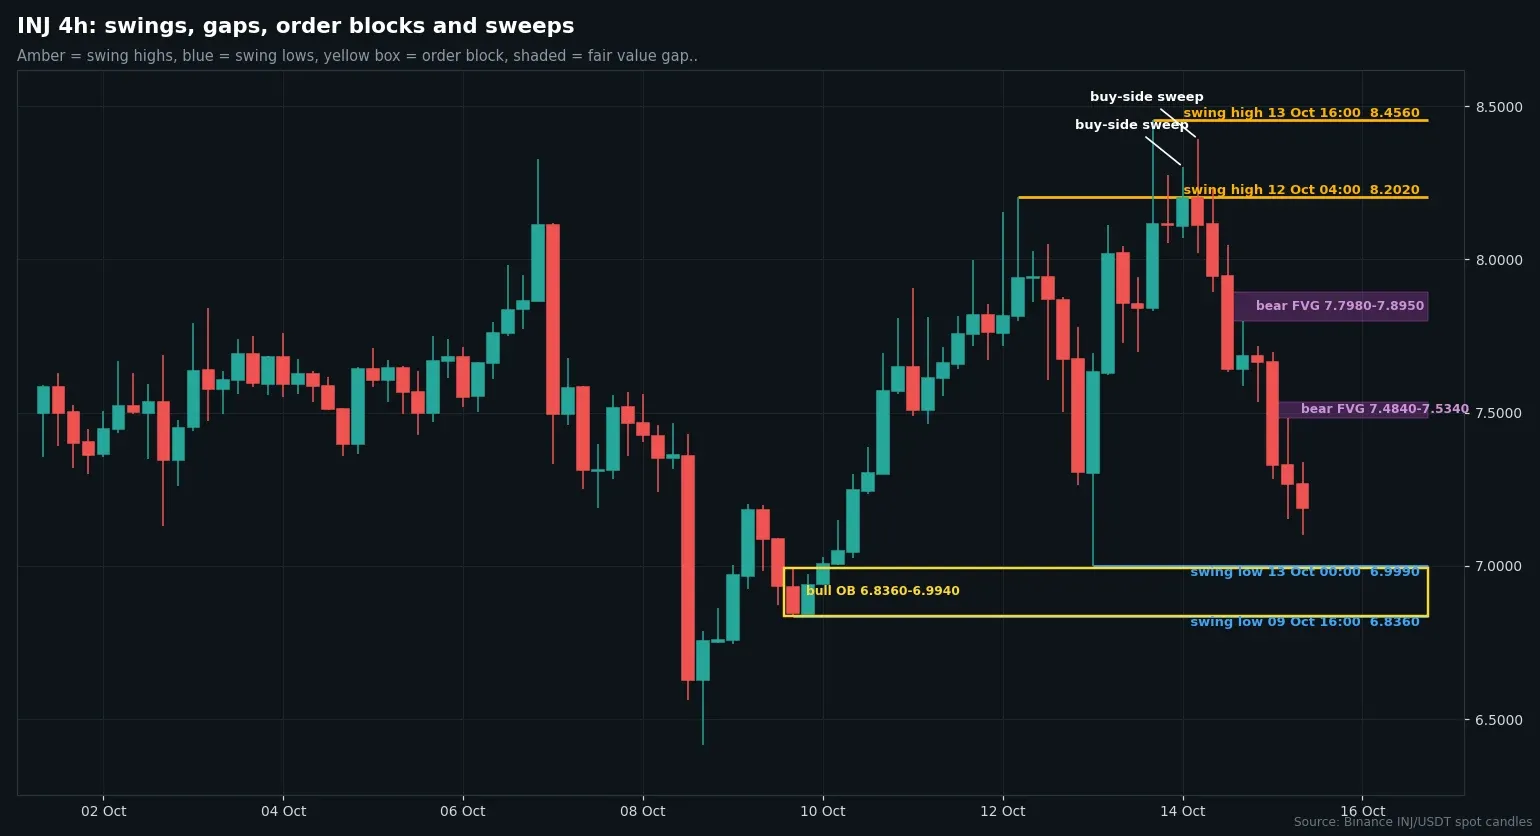
Four-hour INJ/USDT candles from Binance, with swing points, order blocks and fair value gaps drawn from the data. Chart by Mwenda.
INJ price analysis: structure and the daily block
On the daily chart INJ broke structure to the downside on October 8 by taking out $7.131. The daily swing highs since then sit at $8.349, $8.687 and $8.326. The highs on October 13 and 14 pushed through that last one and failed. Traders call that a buy-side sweep, a grab of orders resting above an obvious high.
A daily bearish order block from October 6 spans $7.502 to $8.326. A block is the last opposite candle before a strong move, and price is now under all of it. INJ also trades below its 20-day average at $7.45, but above the 50-day at $6.81 and the 200-day at $5.70.
The weekly chart still reads up. Its last break of structure was upward in late May at $5.908, and the $7.345 weekly swing high from June sits just above current price.
INJ support shelf and the gaps overhead
On the four-hour chart, two bearish fair value gaps sit overhead, which are empty spaces left when price moves fast. The higher one spans $7.798 to $7.895. A thinner one runs from $7.484 to $7.534.
Support is a shelf. The swing low from October 13 sits at $6.999, and a bullish order block from October 9 spans $6.836 to $6.994. Price is only about 3% above the top of that shelf. A sell-side sweep on October 10 already took out $7.131 and came back, so this area has been tested before.
Two scenarios from here
The constructive case needs a four-hour close above $7.534, which would fill the smaller gap. A close above $7.895 would clear the larger one and put the $8.326 daily high back in view.
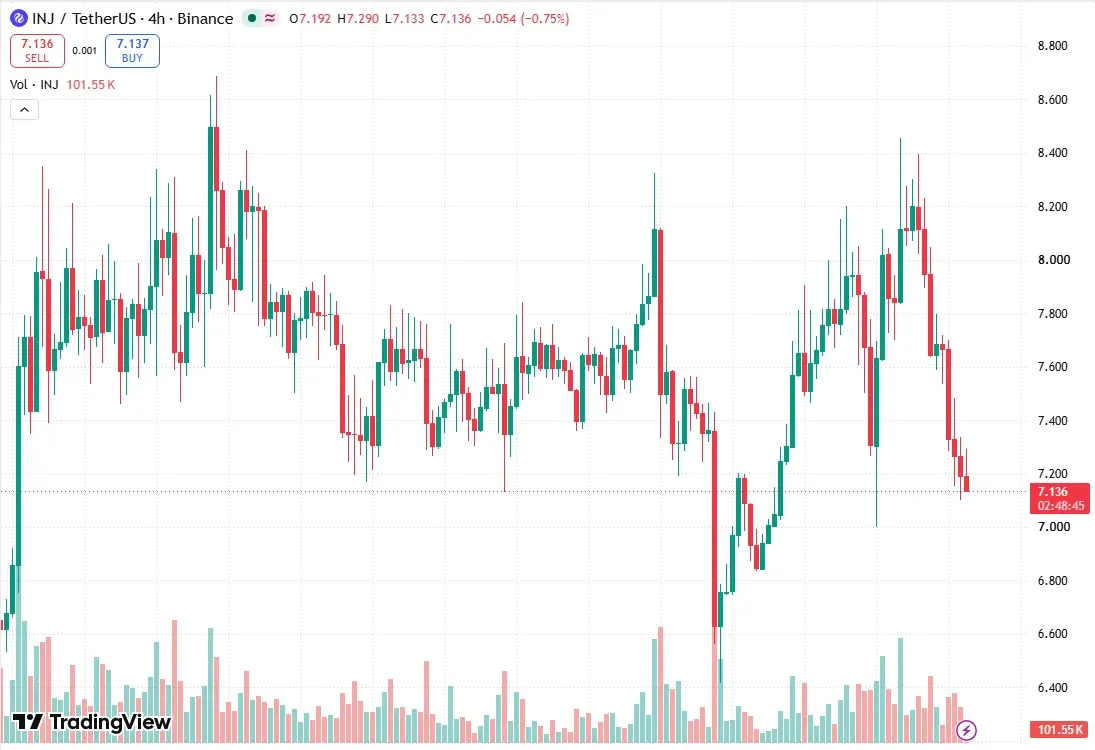
INJ/USDT four-hour chart on TradingView, captured at 13:11 UTC on October 15. Chart by Mwenda.
The cautious case starts with a four-hour close under $6.999. That would put the order block in play, with $6.836 as its base. Below that sits the October 8 low at $6.417. Either idea loses weight if price returns to the other side of $7.328, the close of the 00:00 UTC candle.
BTC trades above its 100-day average and INJ sits inside its recent range, so we have no lean. Levels use closed Binance candles through 12:00 UTC on October 15. This INJ price analysis describes history and is not advice to buy or sell.
Loading…
Written by
Mwenda is a skilled crypto journalist and expert in blockchain technology, digital assets, and decentralized finance. He has a talent for translating complex concepts into engaging, informative content. With a deep understanding of the industry, Mwenda delivers accurate analysis that appeals to beginners and seasoned enthusiasts.
View full profile →Related News

ZK Price Analysis: An 18x Volume Spike Fades From $0.0188
ZK price analysis: the ZKsync token gained 44% in a week and hit $0.0188 on 18x volume before fading. Four-hour levels, blocks and two scenarios with triggers.

ZEC Price Analysis: A 13.8% Slide Reaches The $1,086 Block
ZEC price analysis: Zcash fell 14% in 32 hours and closed under $1,112.77. Four-hour levels, a daily order block at $1,086.20 and two scenarios with triggers.

WAL Price Analysis: A Morning Breakout Takes Walrus To $0.0536
WAL price analysis: Walrus broke out on October 14 with a four-hour candle to 0.0515 on heavy volume. Gaps, order block, key levels and two scenarios inside.