ZEC Price Analysis: A 13.8% Slide Reaches The $1,086 Block
ZEC price analysis: Zcash fell 14% in 32 hours and closed under $1,112.77. Four-hour levels, a daily order block at $1,086.20 and two scenarios with triggers.

In this article+
Zcash lost about 14% in 32 hours, and the sellers did not wait for the daily close. The four-hour candle that closed at 04:00 UTC on October 15 finished at $1,101.15, below the $1,112.77 swing low from October 8. This ZEC price analysis follows that break down to the next block.
ZEC price analysis: the slide in candles
ZEC closed the 04:00 UTC candle on October 14 at $1,266.45. By the 12:00 UTC close on October 15 it was $1,091.63. Two candles did most of the damage. The 12:00 UTC candle on October 14 dropped 7.9%, from $1,242.36 to $1,143.92.
The 00:00 UTC candle on October 15 fell another 4% and carried 78,562 ZEC of volume. That is about 3.6 times the median four-hour volume of 21,823 ZEC and the busiest of the last 14 candles. The low of the session so far is $1,075.00.
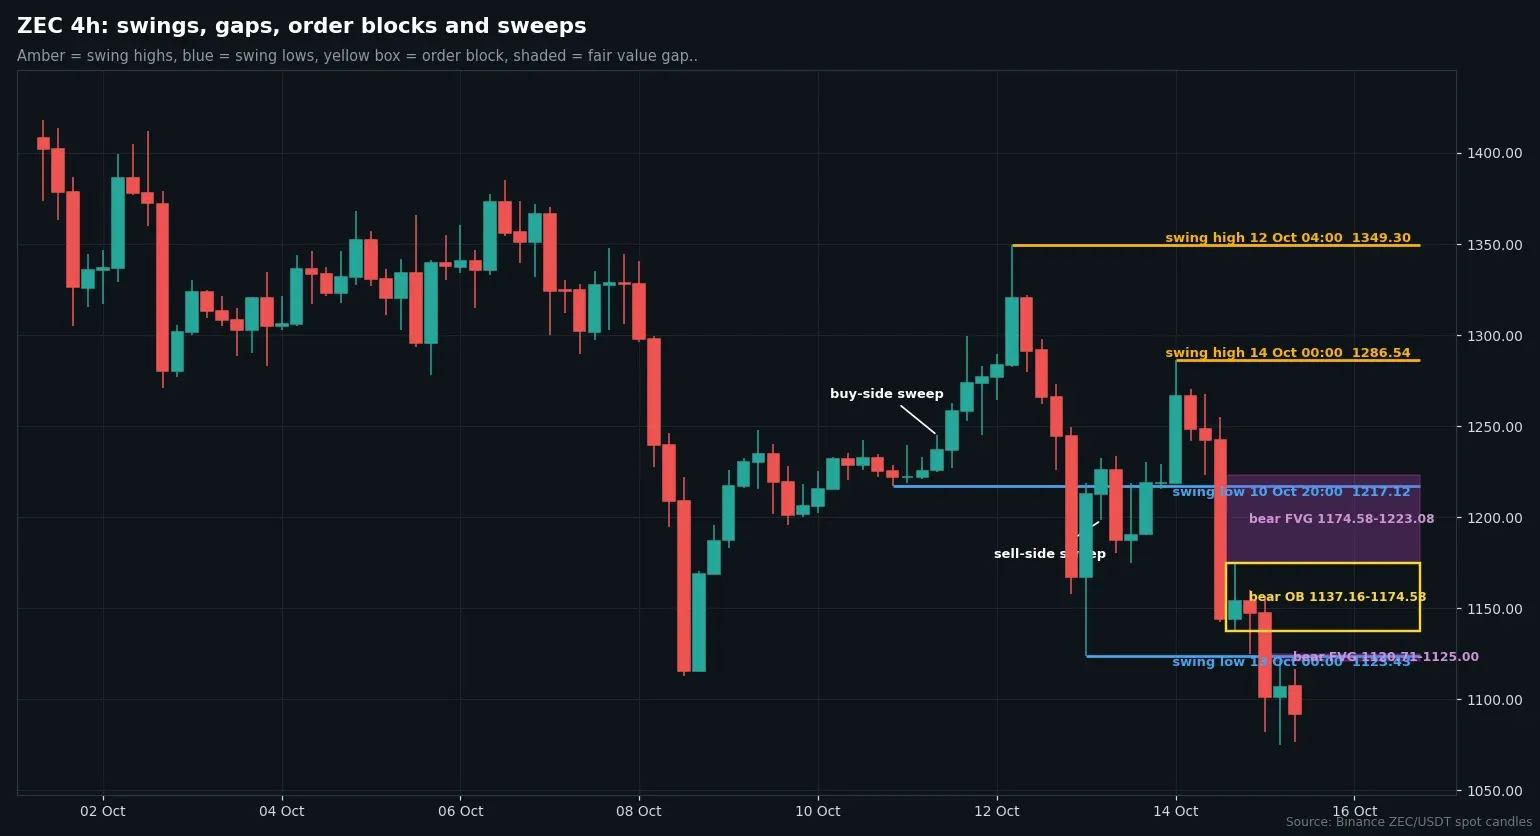
Four-hour ZEC/USDT candles from Binance, with swing points, order blocks and fair value gaps drawn from the data. Chart by Daniel Kiprop.
Structure, averages and the daily block
On the daily chart, ZEC broke structure to the downside on October 8 by taking out $1,271.09. It has made lower swing highs since, at $1,385.00 on October 6 and $1,286.54 on October 14. Price now sits under the 20-day average at $1,283.54 and the 50-day at $1,188.13.
The 200-day average is still far below at $762.87. On the weekly chart the last break of structure was upward, and the weekly swing highs of $560 and $690 are well under today's price. Higher timeframes lean up, while the lower ones lean down.
A daily bullish order block from September 15 spans $1,086.20 to $1,169.41. A block is the last opposite candle before a strong move. ZEC closed the 08:00 UTC candle at $1,091.63, only $5.43 above the base of that block.
Gaps and blocks above price
Above price, the four-hour chart is crowded with supply. A bearish order block from October 14 runs from $1,137.16 to $1,174.58. A fair value gap, the empty space a fast move leaves behind, spans $1,174.58 to $1,223.08. A smaller one sits at $1,120.71 to $1,125.00.
One earlier pattern is worth noting. On October 13 at 04:00 UTC, ZEC dipped to $1,198.20 under the $1,217.12 swing low and was back above it within hours. Traders call that a sweep. Price then rose to $1,286.54 before this slide began.
What the ETF flow table adds
Farside Investors lists the Grayscale Zcash fund, ZCSH, with net outflows on six of the last nine sessions. Together they total $60.9 million between October 2 and October 14. The one inflow in that stretch was $3.7 million on October 14. Flows give context to any ZEC price analysis, but they do not explain the move on their own.
Two scenarios from here
The constructive case starts with a four-hour close above $1,112.77, the broken swing low. That would put the bearish block at $1,137.16 to $1,174.58 in play. A close above $1,174.58 would open the gap up to $1,223.08.
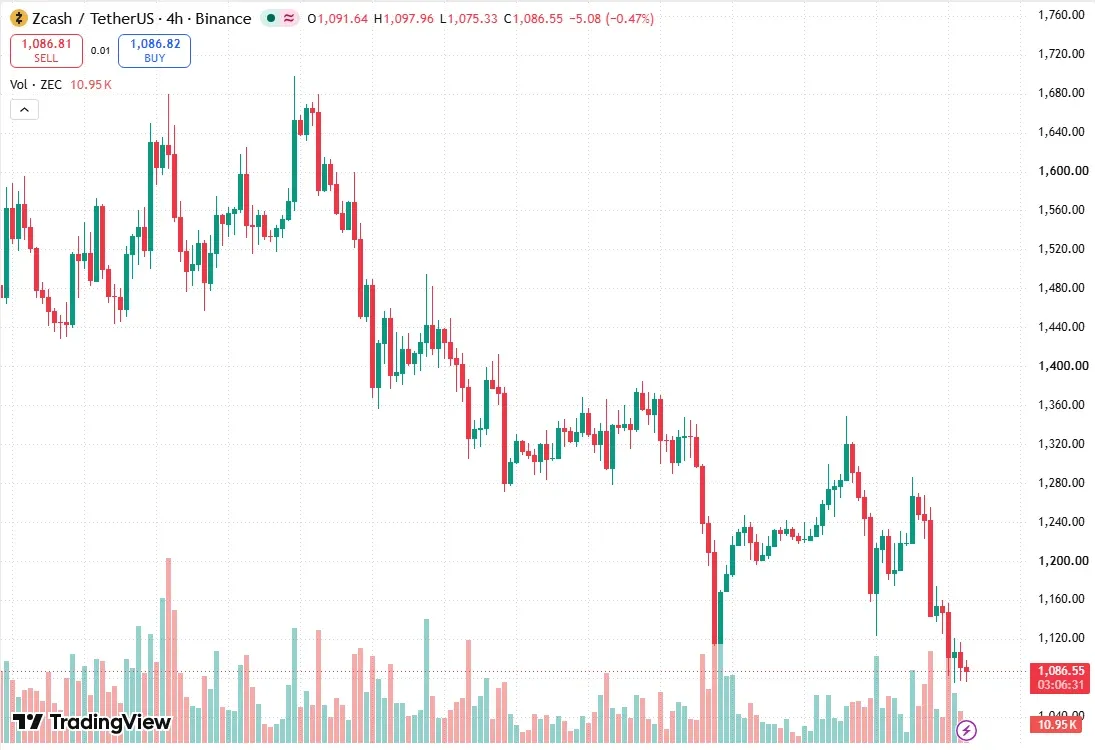
ZEC/USDT four-hour chart on TradingView, captured at 12:53 UTC on October 15. Chart by Daniel Kiprop.
The cautious case needs a four-hour close under $1,075.00, today's low. That would remove the daily block as support and point to $997.00, the top of a September gap. Below that sits $933.12. Both ideas lose weight if price returns to the other side of $1,112.77.
BTC trades above its 100-day average, so the wider market is not weak. ZEC itself sits below its 10-day low, which is a short-term negative. We have no lean here. Levels come from closed Binance candles through 12:00 UTC on October 15, and this ZEC price analysis describes history only. It is not advice to buy or sell.
Loading…
Written by
Daniel Kiprop covers exchanges, listings, stablecoins and institutional crypto moves for Times of Crypto Era. Stories start from company filings and official announcements, not secondary coverage.
View full profile →Related News

WAL Price Analysis: A Morning Breakout Takes Walrus To $0.0536
WAL price analysis: Walrus broke out on October 14 with a four-hour candle to 0.0515 on heavy volume. Gaps, order block, key levels and two scenarios inside.

Aave Risk Stewards Cut USDtb Cap 67% And Close LDO Deposits
LlamaRisk's October 13 post cuts the Aave USDtb cap 67%, closes LDO deposits with a cap of 1 and lifts USDC caps on Monad. Aave risk steward changes explained.

Balancer BEETS Burn Proposal Would Destroy 10M Tokens The DAO Holds
A forum draft asks Balancer's DAO to burn its 10 million BEETS on Sonic. The Balancer BEETS burn would remove nearly 4% of supply. Details and on-chain check.