WAL Price Analysis: A Morning Breakout Takes Walrus To $0.0536
WAL price analysis: Walrus broke out on October 14 with a four-hour candle to 0.0515 on heavy volume. Gaps, order block, key levels and two scenarios inside.

In this article+
Walrus broke out in a single morning. The WAL token opened October 14 at $0.0385 on Binance. By 10:00 UTC it had printed a high of $0.0536, its highest level since early June. About $16 million had traded by then, against a daily average of roughly $2 million over the previous nine days. This WAL price analysis uses closed four-hour candles, which stop at 08:00 UTC, so the live price sits outside the levels below.
WAL price analysis: how the breakout unfolded
The day started quietly. The 00:00 UTC candle ran from $0.0385 to $0.0430 and closed at $0.0400, an early sign of demand. The next candle, from 04:00 to 08:00 UTC, did the heavy lifting.
That candle opened at $0.0400, ran up to $0.0515 and closed at $0.0486. It finished about 22% above its open. In one stroke it cleared the $0.0448 and $0.0444 highs from October 10 and 11. Both of those earlier spikes had faded by the end of their days.
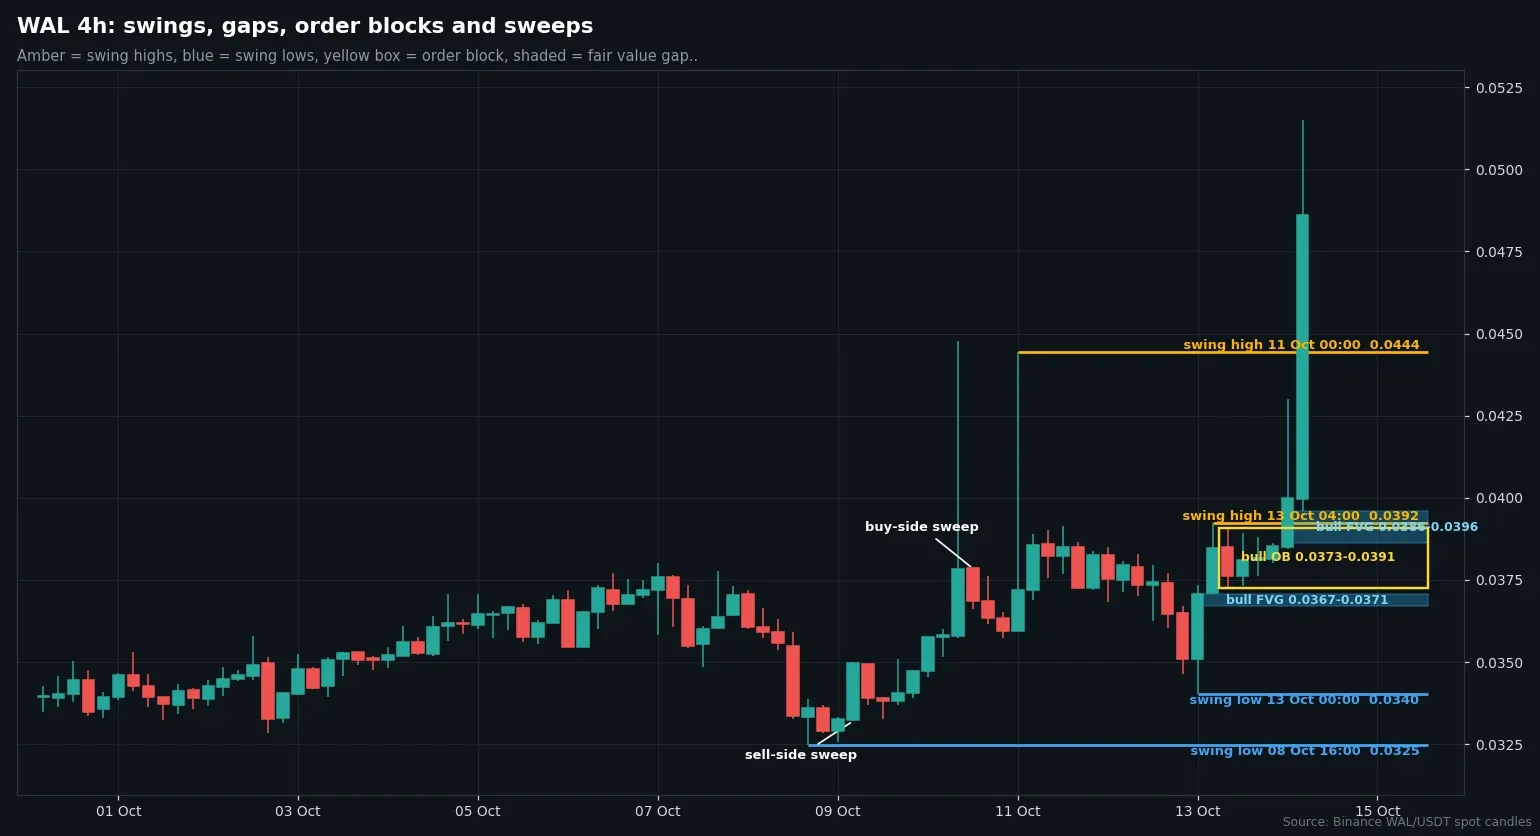
Four-hour WAL/USDT candles from Binance data. Chart by Martin.
Gaps and blocks in the WAL price analysis
A fast breakout opens fair value gaps, areas where candles barely overlap. The one from the 04:00 candle sits between $0.0386 and $0.0396. Below it, a bullish order block from October 13 spans $0.0373 to $0.0391, and another gap runs from $0.0367 to $0.0371. These are the zones most likely to matter if price pulls back.
The recent swing lows sit at $0.0340 from October 13 and $0.0325 from October 8. The second of those came with a quick sweep under the earlier low, which recovered within the same session. Together they mark where buyers stepped in before the breakout began, and they are the first places to check if momentum fades. Those levels came from the quiet days that preceded this morning.
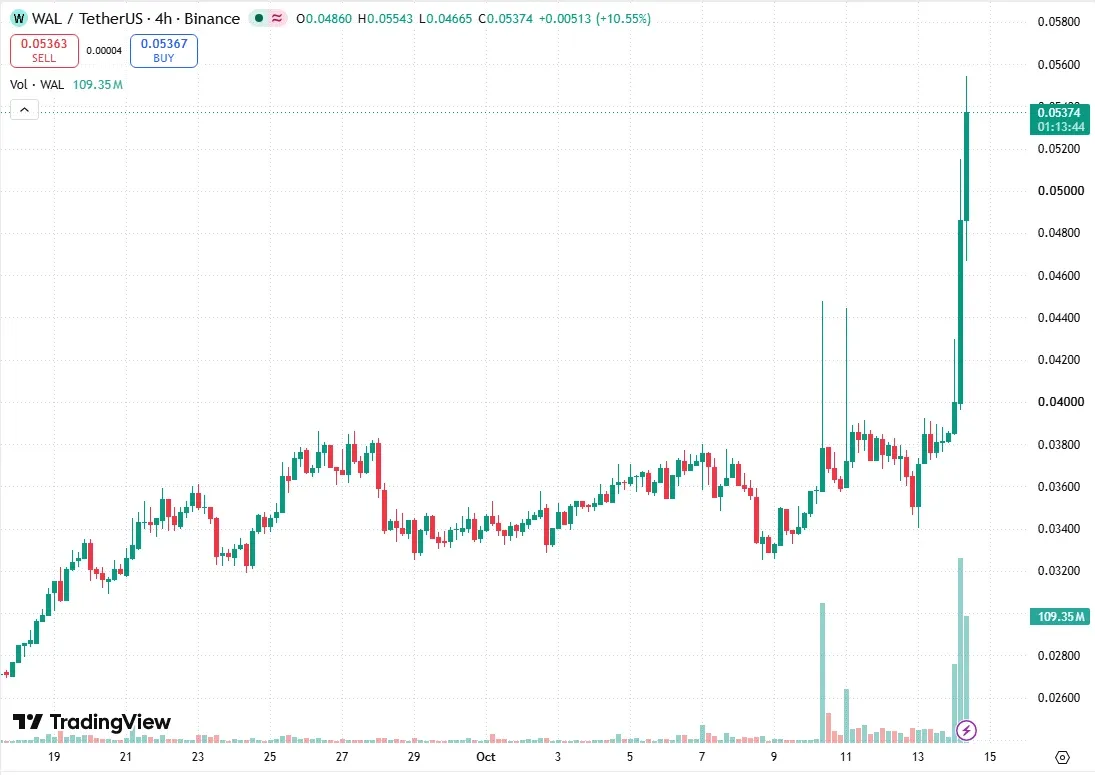
WAL/USDT four-hour chart on TradingView. Chart by Martin.
Averages and the larger trend
On the daily chart the last closed-candle price of $0.0486 sat just under the 200-day average. The 20-day and 50-day lines are far lower, in the mid-three cents. Reclaiming the 200-day average is the first big test for any follow-through.
The live price of about $0.0528 at 10:00 UTC is above all three, though it is not a closed candle yet and can still change. The weekly trend still reads down, with a swing high of $0.1301 from April. WAL is up roughly 160% from the $0.0200 weekly low of August 10, but the bigger structure has not yet turned.
Two scenarios from four-hour closes
The constructive case needs a four-hour close above $0.0515, the high of the breakout candle. That would extend the move toward the June levels. The cautious case begins with a close under $0.0444, which would put the breakout back inside its old range.
A close under $0.0396 would erase most of the move. It would also bring the order block into play, the area where the morning's gap began. Every level in this WAL price analysis comes from closed Binance candles through 08:00 UTC on October 14, and none of it is trade advice.
Loading…
Written by
Writer and editor at Times of Crypto Era. Covers Bitcoin, DeFi, and market structure.
View full profile →Related News

Aave Risk Stewards Cut USDtb Cap 67% And Close LDO Deposits
LlamaRisk's October 13 post cuts the Aave USDtb cap 67%, closes LDO deposits with a cap of 1 and lifts USDC caps on Monad. Aave risk steward changes explained.

Balancer BEETS Burn Proposal Would Destroy 10M Tokens The DAO Holds
A forum draft asks Balancer's DAO to burn its 10 million BEETS on Sonic. The Balancer BEETS burn would remove nearly 4% of supply. Details and on-chain check.

GNS Price Analysis: A 40x Volume Spike Takes GNS To $0.858
GNS price analysis: Gains Network's token hit 0.858 on October 13 on 40 times normal volume, then pulled back into a gap. Key levels and two scenarios.