TIA Sell-Off Erases Most Of The $0.769 Spike, Tests $0.5696
The TIA sell-off took Celestia's token from $0.769 to $0.5696 in five days. Read the closed candles, key levels and two 4h-close paths from Binance data.

In this article+
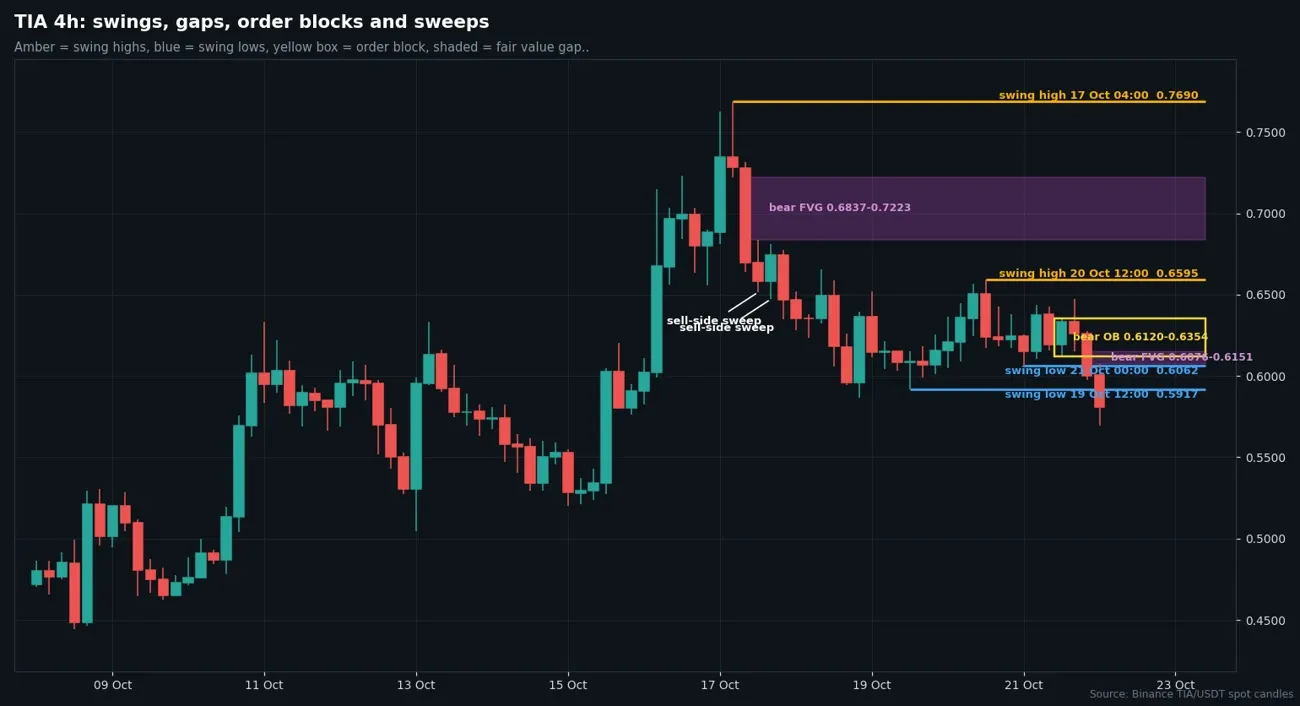
Four-hour candles from Binance spot, with swing points, gaps and order blocks drawn in. Chart by Daniel Kiprop.
TIA has now handed back most of its mid-October spike. The Celestia token touched $0.769 on October 17, and on October 22 it traded as low as $0.5696. This TIA sell-off reads closed Binance candles only, with the last full four-hour candle ending at 04:00 UTC.
How the TIA sell-off built up
October 16 did the lifting. The daily candle opened at $0.5908, reached $0.7233 and closed at $0.6885 on about 60 million tokens. A day later price ran on to $0.7690, the high, but closed at $0.6466. That is a long upper wick on a daily chart.
Closes since then stepped down, apart from a small bounce on the 20th. By October 21 the daily close had slipped to $0.6002. Volume faded too, from about 42 million tokens on the 17th to under 18 million on the 21st. That cooling is part of the TIA sell-off.
Then came the latest four-hour candle. It opened at $0.6004 and closed at $0.5807 after a low of $0.5696, on about 4.2 million tokens. That close sits under $0.6062, the October 21 swing low, so the four-hour structure turned down.
What sits above and below price
Overhead there are two layers. A bearish four-hour gap covers $0.6076 to $0.6151. Above it a bearish order block reaches from $0.6120 to $0.6354, and the October 20 high at $0.6595 caps both.
Underneath, a bullish gap runs from $0.5432 to $0.5800. A bullish block from October 15 spans $0.5800 to $0.6204, and price is trading through it now. Beyond those, the prior month high at $0.5379 comes next, then $0.5041.
Daily and weekly charts still read up. Price sits just over the 20-day exponential average, near $0.564. The 50-day is far lower at $0.492. Bitcoin is above its 100-day average, and the coin is inside its 20-day range, about a quarter under the high.
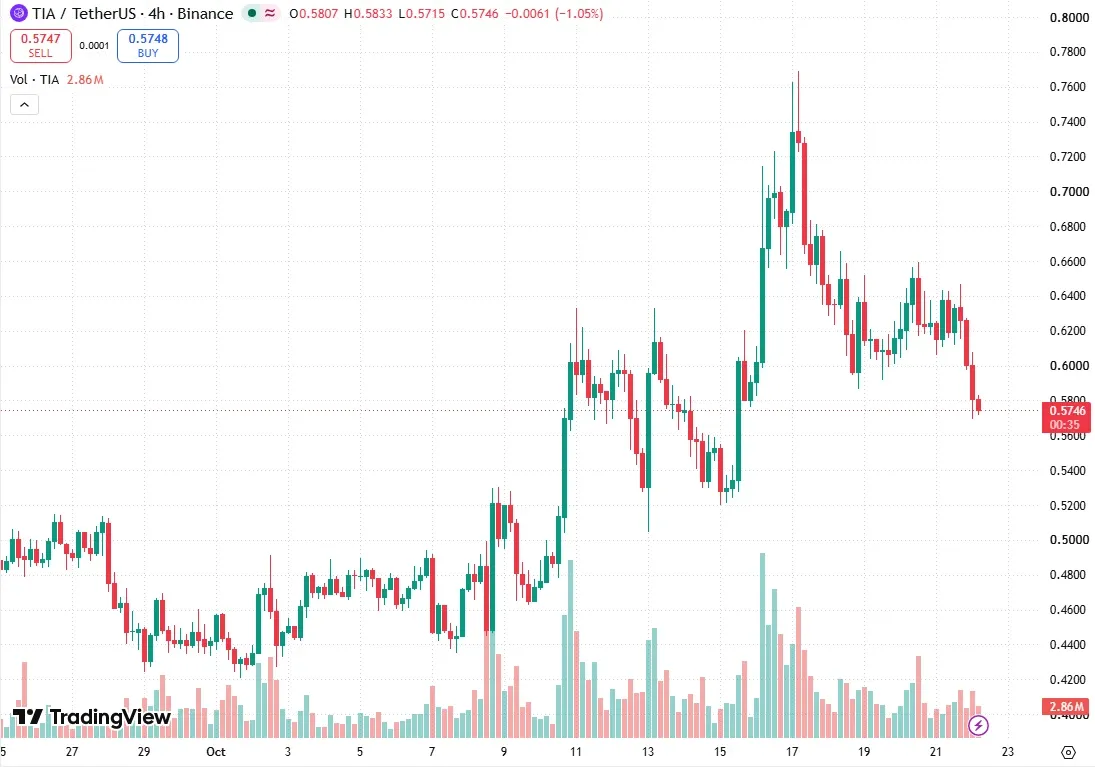
TIA against Tether on the four-hour chart, read at 07:20 UTC on October 22. Source: TradingView, TIAUSDT on Binance.
Positioning behind the TIA sell-off
Binance's account ratio showed about 59% of accounts long at 07:00 UTC, and the last three funding prints were all slightly negative. That is a snapshot only. Celestia's Fibre upgrade went live on October 20, as covered in our Celestia v10 report, and TIA closed that day at $0.6245.
Two TIA paths from the 4h closes
Upside needs a four-hour close above $0.6151, the top of the bearish gap. That opens $0.6354 and then $0.6595. A four-hour close under $0.5696 cancels it.
Downside starts with a four-hour close below $0.5696, today's low. Next stops are $0.5432, the floor of the bullish gap, and then $0.5379. A four-hour close back above $0.5833 cancels that path.
We have no lean here. After a spike like this, the TIA sell-off can be a reset inside an uptrend or the start of a deeper retrace. Every level comes from closed Binance candles, and each is just a reference point.
Loading…
Written by
Daniel Kiprop covers exchanges, listings, stablecoins and institutional crypto moves for Times of Crypto Era. Stories start from company filings and official announcements, not secondary coverage.
View full profile →Related News

INJ Buy-Side Sweep At $9.417 Fades Into An $8.095 Flush
An INJ buy-side sweep to $9.417 faded into an $8.095 low on October 22. Read closed Binance candle levels, the daily trend and two 4h-close scenarios.

XRP Ledger Amendment fixCleanup3_4_0 Cannot Go Live Before Nov 4
One XRP Ledger amendment, fixCleanup3_4_0, cannot activate before Nov 4, XRPSCAN shows. See the vote counts, the 80% rule and what the fix bundle changes.

Ondo Stocks On Solana Reach 1inch, But Issuer Rankings Differ
Ondo stocks on Solana reached 1inch on October 20. RWA.xyz data on October 21 ranks Ondo second among tokenized-stock issuers, not first as the post says.