Whales Open Massive Leveraged ETH Longs On Hyperliquid
Multiple traders posted matching Hyperliquid screenshots showing eight and ten figure leveraged ETH long positions opened within hours of each other, with liquidation prices clustered near 2,200 dollars while ETH itself traded near 2,500 dollars.

In this article+
Someone opened a $110 million leveraged bet on Ethereum this afternoon, and the screenshot spread across trading circles within minutes. It was not the only huge position that showed up on the same exchange within hours.
Three Whales, One Afternoon
Ted posted a screenshot on August 30 showing a $110,000,000 ETH long opened on Hyperliquid with 8x leverage, carrying a liquidation price of $2,242. The screenshot includes the trader's live position panel, not just a claimed number.
Within roughly the same window, separate accounts flagged two more large ETH longs on the same platform: a $102.3 million position at 10x leverage with a $2,241 liquidation price, and an $81.25 million position at 10x leverage liquidating at $2,222. All three carried strikingly similar liquidation levels, clustered a few dollars apart.
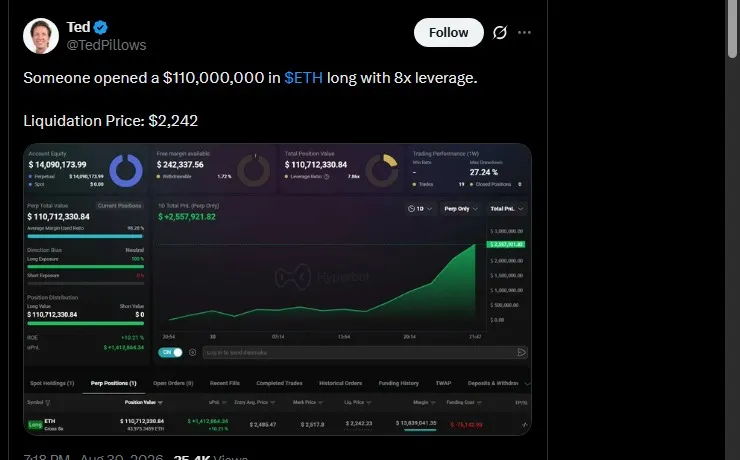
Ted's post, screenshotted August 30, 2026.
Why The Liquidation Prices Line Up
Liquidation price depends on entry price, leverage, and margin, so three separate traders landing within twenty dollars of each other is not a coincidence of round numbers. It suggests all three opened around the same entry price, within the same short window, using similar leverage ratios.
That does not prove coordination. It is equally consistent with several large traders reacting to the same short-term signal, whether that is a funding rate shift, an options flow print, or simple momentum chasing after ETH's intraday move.
The Price Action Behind The Bets
CoinGecko showed ETH trading at $2,499.46 on August 30, up 1.9% over 24 hours, after a sharp intraday move from roughly $2,460 up toward $2,530 before settling back near $2,500. That places every one of the three liquidation prices between 10% and 11% below the live market.
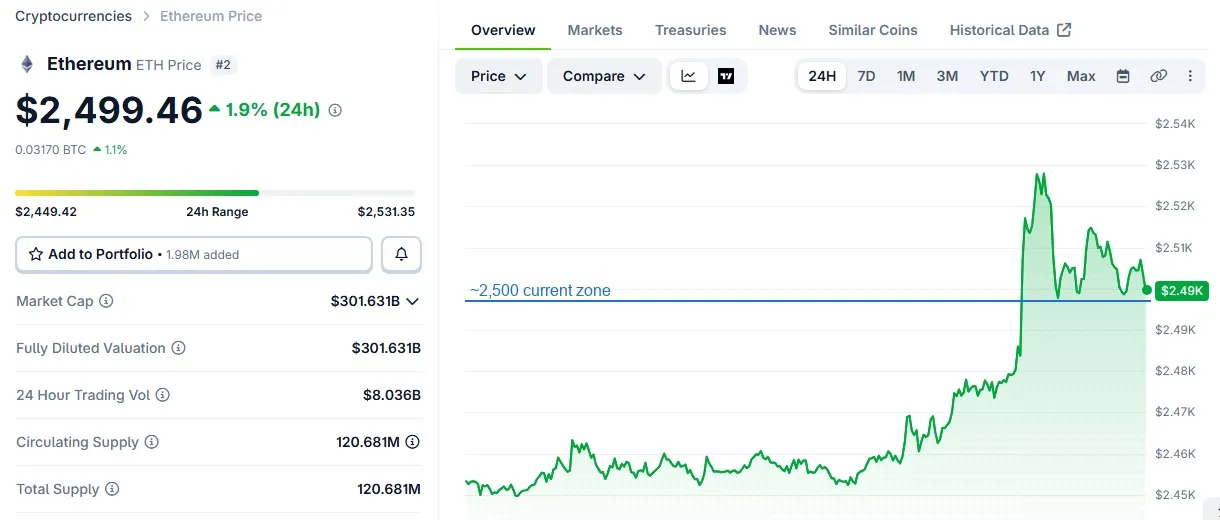
CoinGecko's live chart, showing ETH near the $2,500 zone after its intraday spike on August 30, 2026.
That is a meaningful cushion, but leverage cuts both ways. A slide back toward the $2,240 to $2,220 band, roughly where ETH traded a few sessions earlier, would put all three positions at risk of forced liquidation within the same narrow band.
What This Does And Does Not Tell Traders
Large leveraged positions on a transparent perpetuals exchange are visible to anyone who looks, which is part of why they circulate so fast on social media. They are not proof of inside information, despite how often that gets implied in the replies under posts like these.
What they do show is real capital, not just talk, positioned for ETH to keep climbing rather than reverse. If the trade works, it works because ETH holds above the mid $2,200s. If it does not, the same public ledger that made the position visible will show the liquidation just as clearly.
Investing in cryptocurrency assets carries substantial risk, including the potential loss of principal, and leveraged positions can be liquidated quickly during sharp price swings.
Written by
Samiran is a well-known crypto writer and founder of Pressefy and News Coverage Agency, and a contributor at Hackernoon. He covers the crypto and blockchain industry with a focus on emerging projects, market trends, and the business side of Web3.
View full profile →Related News

Bitfinex ETH Longs Reach 283K, The Highest Since August 2022
Bitfinex ETH longs jumped from 96K to 304K in two days and sit near 283.5K, the highest since August 2022. See the sampled data and the price backdrop.

STRK Price Doubles In Three Sessions After Starknet L1 Question
STRK price more than doubled in three sessions after StarkWare CEO asked if Starknet should become a layer 1. See the chart, volume, unlock date and caveats.

Binance ETH Reserves Hit A Six-Month Low As Withdrawals Spike
Binance ETH reserves fell to 3.47M ETH, a six-month low, as CryptoQuant counts a record 320,000 withdrawals on Oct 6. See the data next to ETF outflows.