XRP and XLM Slip From Weekly Highs as ETF Inflows Continue
XRP and XLM pulled back about 5% to 7% from their September 23 highs alongside Bitcoin and Ethereum, while US spot XRP ETFs kept taking in money on both days.

XRP and XLM gave back part of their weekly gains over the last 48 hours. The slide was modest by crypto standards, and both coins are already bouncing.
What the Charts Show
According to CoinGecko, XRP reached its weekly high near $1.64 on September 23. It now trades around $1.53, roughly 7% below that peak. Across seven days the token is still up almost 18%.
Stellar followed the same shape. XLM touched about 22.4 cents on September 23 and sits near 21.3 cents at the time of writing. That is a drop of around 5% from the high, though the coin has still gained 14% on the week.
The bounce is visible in the daily numbers. XRP traded between $1.45 and $1.54 over the past 24 hours and gained about 1.8%. XLM ranged from 19.7 cents to 21.4 cents and gained around 5%.
Trading volume stayed healthy on both. XRP changed hands for about $3.9 billion in 24 hours, while XLM saw roughly $327 million. XRP ranks fifth by market cap at about $96 billion, and XLM sits twentieth at $7.4 billion.
Both charts show the same pattern. Price ran up to the September 23 highs, sold off, then started climbing again by late Thursday.
A Broader Pullback
Neither coin moved alone. CoinGecko data for Bitcoin shows the largest coin peaked near $87,150 on September 23 and now trades around $84,400. That is a decline of about 3%.
Ethereum topped out near $2,780 on September 21 and sits close to $2,695, also about 3% lower. XRP and XLM turned at the same time as the two biggest coins.
Sentiment cooled but did not break. CoinGecko's Fear and Greed reading sat at 46, which it labels Neutral, with the total crypto market cap near $2.96 trillion.
We found no confirmed coin-specific bad news behind the dip. The move looks like a market-wide cooldown after a strong run, and the recovery so far is partial.
The pullback also sits inside a much stronger week. XRP's seven-day low was about $1.29 on September 17, so the token is up roughly 18% from there. XLM's low of 18.3 cents on September 18 puts it about 16% higher.
Institutions Kept Buying
Spot XRP funds did not flinch. CoinGlass shows US XRP ETFs took in $20.02 million on September 22 and $18.04 million on September 23.
Bitwise led both days with $19.16 million and $11.54 million. Franklin added $862,200 on September 22 and $6.5 million on September 23.
Inflows on both days of the pullback offer a useful counterweight to the price drop. Buyers kept showing up while the chart cooled.
What to Watch Next
The September 23 highs now act as the ceiling for both charts. A move back above $1.64 for XRP or 22.4 cents for XLM would erase the pullback. Another rejection there would point to more sideways trading.
The September 17 and 18 lows mark the floor of the week's range, at $1.29 for XRP and 18.3 cents for XLM. Bitcoin's direction usually sets the pace for both coins.
This article is for information only and is not investment advice. Prices move fast, so check live data before making any decision.
Related News
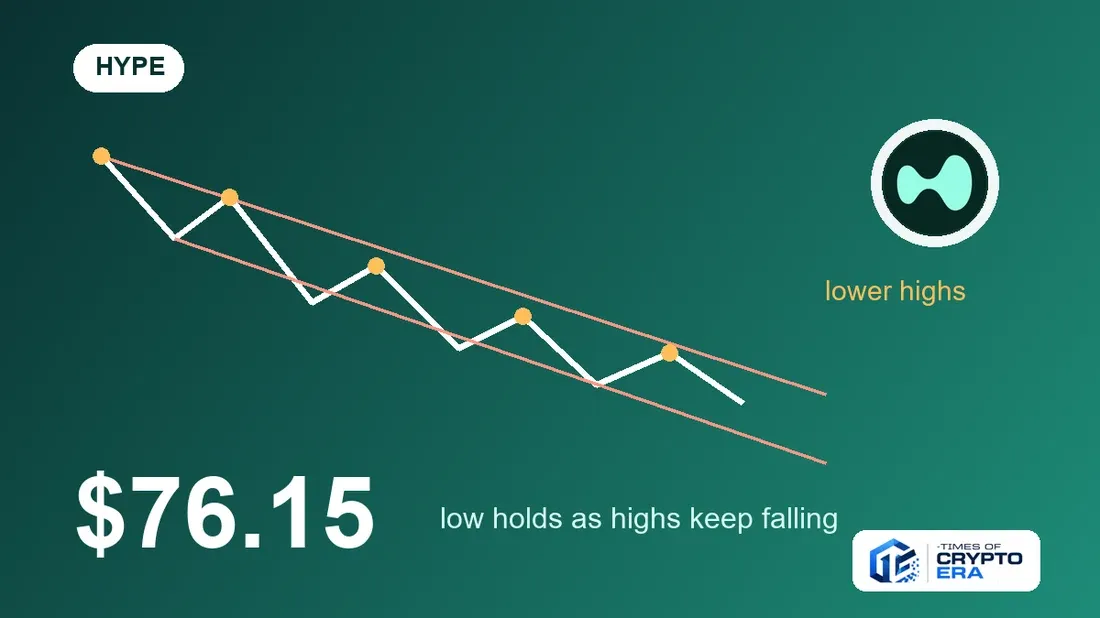
HYPE Price Analysis: Lower Highs Press On A $76.15 Low
HYPE price analysis: lower highs from $95.25 and a $76.15 low keep the trend down. Four-hour levels, gaps and two closed-candle scenarios for the next move.
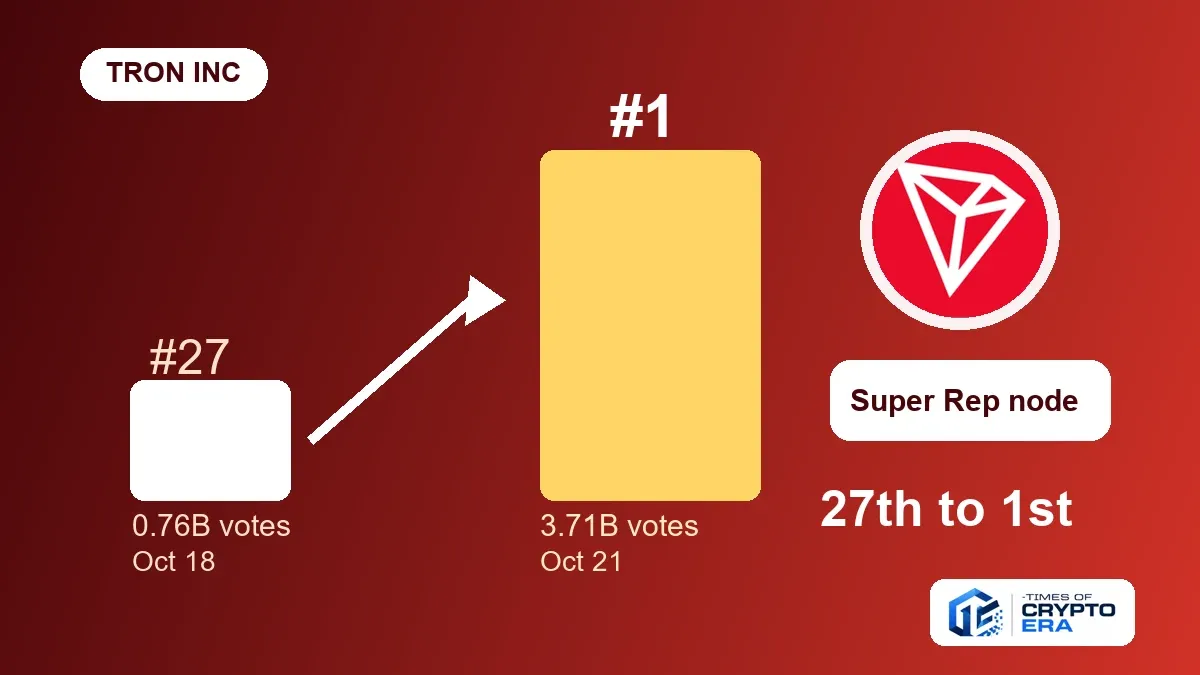
Tron Inc Super Representative Rises To #1 With 3.71B Votes
The Tron Inc Super Representative node says it hit No. 1 on TRON with 3.71B votes, up from 0.76B at rank 27. Release claims were checked against public data.
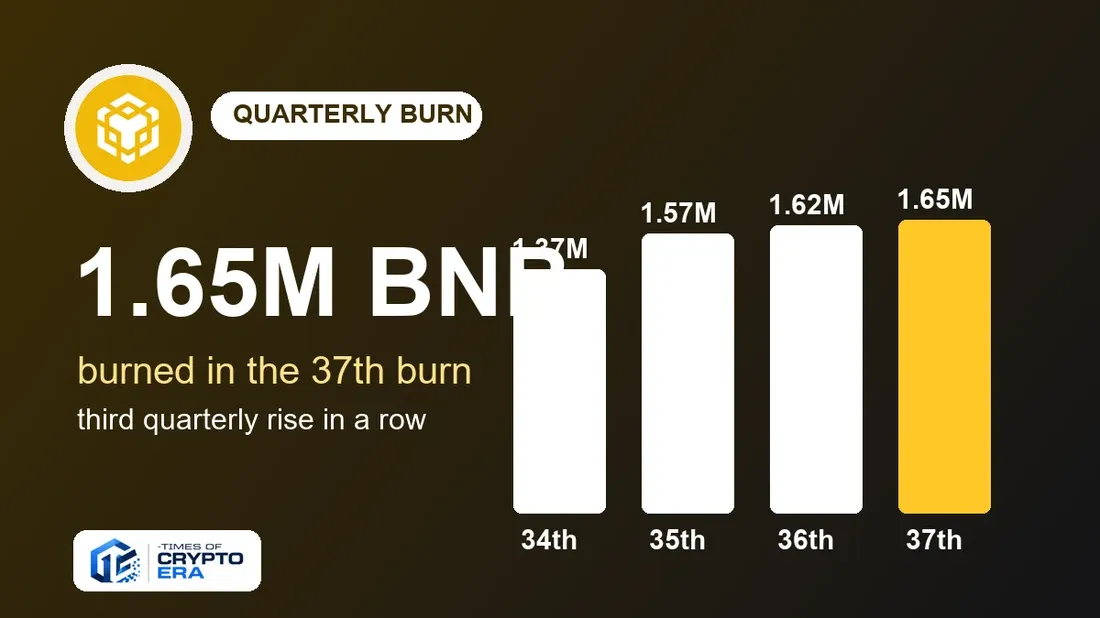
BNB Burn Reaches 1.65M BNB, Third Straight Quarterly Rise
BNB burn totals 1,646,196.44 BNB in the 37th quarterly round, worth about $1.2B, as supply falls to 131.5M BNB, the BNB Foundation said on October 19, 2026.
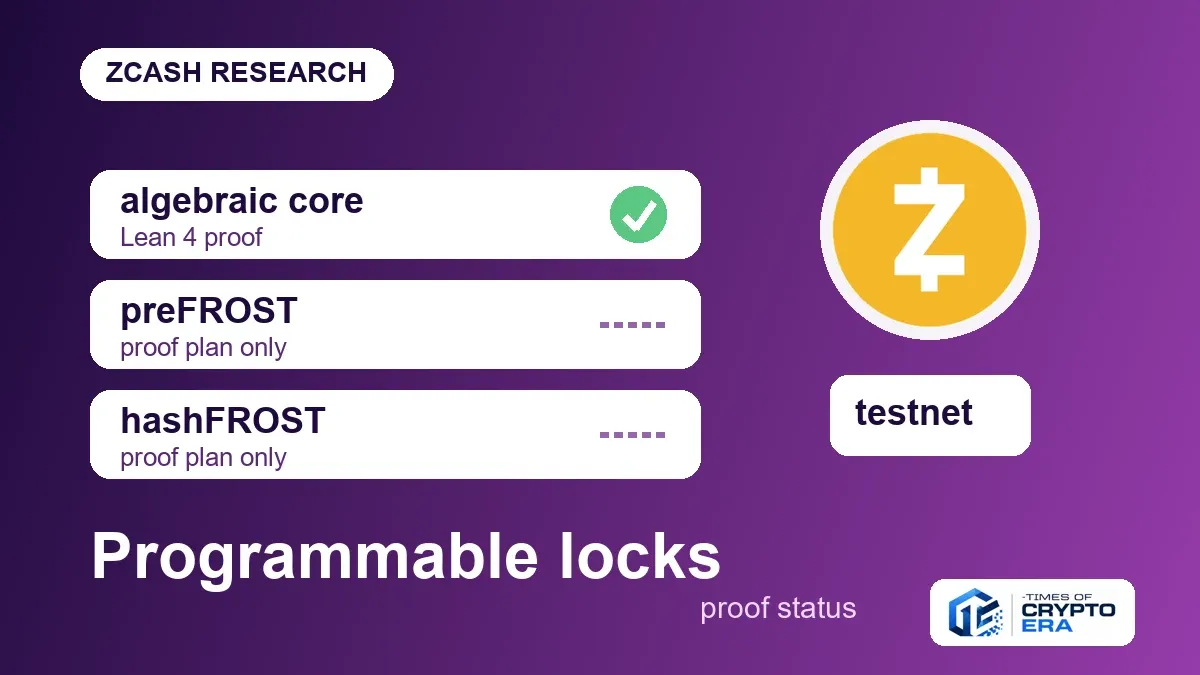
Zcash Programmable Locks Paper Gives Only A Plan For Two Proofs
Zcash programmable locks were announced on October 21. The paper proves its core in Lean 4 but gives only a proof plan for preFROST and hashFROST security.